
Monitoring
Logs, log levels, the central log sink, and per-block events.
Octo gives you two ways to see what a flow is doing. Logs cover structured application logs you emit from flows, the runtime's own process logs, and, on the platform, a central sink that aggregates every replica's output into one searchable stream. Block events are a programmatic stream of every block invocation. This page covers each layer and how they connect.
For numbers rather than lines, health probes and Prometheus metrics on the runtime's admin port, see Observability. It is built on the event streams described here, so you do not need to write Go to get per-flow and per-block metrics.
For the path of one particular message rather than numbers across all of them, every flow, block and model turn it touched joined by one id, see Tracing. It is built on the same two streams, and likewise needs no Go from you.
Logging from flows: the log block
The log block is a pass-through wire tap: it logs and forwards the message unchanged.
process:
  - type: log
    settings:
      message: '"order " + body.id + " received"'   # CEL; omit to log the JSON body
      level: info                                   # debug/info/warn/error (default info)
message is a CEL expression over body, vars, eventID, and correlationID. With no message, the block logs the message's JSON body. level is the level this line is emitted at. full: true additionally attaches the whole message (correlation ID, variables, body, schema) as structured attributes; pair it with a json logger for a clean debugging dump.
Controlling output: the logger connector
By default the log block writes through the process default logger. To control the destination and format, declare a logger connector and reference it by name. The connector owns its output, opening a file on start and closing it on shutdown like any other connector resource.
| Setting | Values | Default |
|---|---|---|
output | stdout, stderr, a file path | stdout |
format | text, json | text |
level | debug/info/warn/error | info |
addSource | true/false | false |
A logger's level is the minimum level it emits; the log block's level is the level a line is emitted at. Every setting defaults, so - { name: audit, type: logger } is a valid declaration.
connectors:
  - name: audit
    type: logger
    settings:
      output: /tmp/octo-audit.log
      format: json

flows:
  - name: audit-ticks
    source: { connector: ticker, type: cron, settings: { schedule: "@every 2s" } }
    process:
      - type: log
        settings:
          logger: audit          # write through the named logger
          message: '"tick"'
See the logger connector reference.
Runtime process logs and LOG_LEVEL
The runtime itself logs through Go's slog to stderr: startup and shutdown, config loads and reloads, connector and flow lifecycle, and every failed message (flow name, event ID, and error).
The LOG_LEVEL environment variable sets the minimum level: debug, info, warn, or error (case-insensitive; default info; an invalid value logs a warning and falls back to info).
LOG_LEVEL=debug octo run --config my-flow.yamlRunning standalone, stderr is the whole story: nothing is shipped anywhere. LOG_LEVEL=debug plus a log block with full: true is the standard local debugging setup.
Flow lifecycle events (started/completed/dropped/failed) stay on a process-local bus (core.EventBus), and block events on a process-local dispatcher (core.BlockEvents). These are two separate mechanisms, neither of which leaves the process or is shipped to a central trace store.
They are what the runtime's own metrics are built from: --metrics exports per-flow numbers from the first stream, and --metrics-blocks adds per-block numbers from the second on the admin port, with no Go code from you. Subscribe directly only when you want something the exported metrics do not cover.
Block events
The runtime brackets every block it invokes with a pre-invoke and a post-invoke event. It is the seam to build per-block metrics on, and the seam a flow debugger would use. There is no YAML for it and no CLI flag: you register listeners from Go, embedding the runtime.
Each types.BlockEvent carries:
| Field | |
|---|---|
Kind | pre-invoke or post-invoke |
Flow, Path, BlockType | which block; see the path |
EventID, CorrelationID | which message; joins to the flow-event stream |
OccurredAt | when |
Message | the live message; read the contract below |
Duration, Err, Dropped | post-invoke only: how long it took and how it ended |
post-invoke fires for all three outcomes (the block returned a message, dropped it, or failed), so a counter never misses one.
The path is an address
Path is the block's address in the runtime's grammar, <flow>[<chain>].<block>[<branch>].<block>, for example orders.checkHeader[else].api-call-1. It is the same string octo invoke --spies accepts, so a path you see in a metric is a path you can paste back into the CLI to watch that block.
Two caveats make a path a label rather than something you can always paste back. Two blocks that address ambiguously, meaning two unnamed blocks of the same type in one chain, share a path; name one to give it its own. And a block, branch, route or tool name containing ., [ or ] produces a path the address parser splits the wrong way. Nothing rejects such a name today, so avoid those characters if you want the path to round-trip.
Registering a listener
events := core.DefaultBlockEvents()Listeners run inline, on the flow's own goroutine, and the flow waits for them: pre-invoke before the block runs, post-invoke after it returns. There is no queue and nothing is dropped, so a listener sees every invocation of the blocks it asked for.
AddSyncFor names the blocks you want. This is what telemetry should use: a block nobody named is never built into an event, so watching one address costs the rest of the config one comparison each.
events.AddSyncFor([]string{"orders.charge"}, func(_ context.Context, ev types.BlockEvent) {
    if ev.Kind != types.BlockPostInvoke {
        return
    }
    blockSeconds.WithLabelValues(ev.Flow, ev.Path, ev.BlockType, outcome(ev)).
        Observe(ev.Duration.Seconds())
})
Because this runs on the message's critical path, a listener must be cheap: an atomic update is fine, a network call is not. Resolve label tuples to collectors once and cache them, because WithLabelValues hashes its labels and takes a read lock on the vector's map, a shared cache line written by every core on every block.
AddSync watches every block in every flow. It is for a debugger, or --metrics-blocks '*'. Blocking here holds the flow at this block, which is the point:
events.AddSync(func(ctx context.Context, ev types.BlockEvent) {
    if ev.Kind != types.BlockPreInvoke || !dbg.BreaksAt(ev.Path) {
        return
    }
    dbg.Present(ev.Path, ev.Message.Reported())
    dbg.WaitForResume(ctx)   // blocking here holds the flow at this block
})
Listeners observe. One cannot skip or abort a block; a flow runs the same way whether anything is listening or not. A panic is contained for the same reason: it is logged with its stack, counted, and the block carries on. Emit runs on a flow worker, so a propagating panic would take the process down.
A contained panic still means that listener recorded nothing, so octo_block_listener_panics_total (and events.Panics()) is how much it missed. Non-zero means whatever it feeds is under-reporting; check the log for the stack.
ev.Message is the live message, not a copy. The flow is stopped at this block while your listener runs, so you may read the message and copy it (Clone, Scoped, Reported), but only for as long as the listener is running. The flow resumes mutating it the moment you return, so never retain the pointer: Variables is a plain map, and reading it from another goroutine afterwards is a data race that can panic the process. To inspect contents elsewhere, Clone here and hand the copy to a worker you own. Every other field is copied on the flow's goroutine and is safe anywhere.
A listener is called from every goroutine a flow runs on, its worker pool plus the shared pool for a fork's branches, so it must be safe for concurrent use. Blocking one inside a fork branch holds a pool worker.
There is no async listener. One existed until v0.6, a 1024-deep queue drained by a single goroutine and dropping when full, and it could not work: the producers are every flow worker in the process, so no buffer size makes one consumer keep up with sustained load. If you need slow or blocking work, Clone in a listener and hand the copy to your own worker, where the loss policy is yours to choose.
Listening costs nothing until you register: with no listeners the engine does a nil check and an atomic load per block, allocating nothing.
To give one Service its own dispatcher instead of the process-wide one (two runtimes in a process, or an isolated test) pass runtime.WithBlockEvents(core.NewBlockEvents()).
On the platform: the central log sink
In a cluster deployment (the -tags k8s build), the runtime tees its loggers through a central sink. The default logger keeps writing to the pod's stderr with LOG_LEVEL applied, named logger connectors keep writing to their own output, and every record is also shipped to the platform's log pipeline. Standalone builds ship nothing.
The -tags api build tees the same way, to whatever server it was pointed at, when that server's discovery document says it accepts logs. See The platform API. Records are queued and shipped from one goroutine, and dropped when the queue fills, because a log call must never wait on the network.
The pipeline:
runtime pods --> NATS subject "internal.logs" (fire-and-forget)
                     |
                     v
             observability service (competing consumer)
                     |
                     v
             Postgres "logs" table  <-- editor's log viewer
Each pod publishes structured records to the shared internal.logs subject. Shipping is fire-and-forget so logging never blocks or fails a flow. The observability service (observability/) consumes the subject as a competing consumer, so replicas share the work, and writes each record to Postgres. A stored record carries deployment_id, app_name and app_version (the integration and version tag, stamped from the deployment's environment), ts and level, the rendered message, and any extra structured fields as JSON attrs.
Because records are keyed by deployment, you read one stream per integration no matter how many replicas run.
What the pipeline does under pressure
Shipping is fire-and-forget on core NATS, so a record is delivered at most once and never redelivered. Two consequences matter when you are reading logs during an incident.
The aggregator sheds rather than blocks. Delivered records wait in a bounded buffer while workers write them. If writes fall behind far enough to fill it, further records are dropped and a warning naming the running total is logged at most once every ten seconds. Expect a gap in history rather than a stall.
A restart flushes what it holds. On shutdown the aggregator finishes the writes already in flight and drains its buffer instead of abandoning records the broker will not send again. That work gets five seconds, so a database that has stopped answering cannot hold the shutdown open past it.
If you see the shedding warning, the aggregator is not keeping up with its database: check the octo-observability deployment's replica count and the database before trusting a quiet period in the history.
The log viewer
The editor's logs view queries that history. You can filter by deployment, level (for example, just ERROR and WARN), a time range, and free-text search on the message. It tails live, polling for the newest rows and sticking to the bottom until you scroll up. Filters mirror to the URL, so a filtered query is a link you can share.
Paging back through history is newest first and keyset-based, and the cursor is a pair, <rfc3339nano>|<logId>, returned as next_before and passed back as ?before=. It is a pair because log lines tie: one request emits several stamped from the same clock read, and a cursor on the timestamp alone either skips the rows that tie across a page boundary or serves them twice. Treat it as opaque.
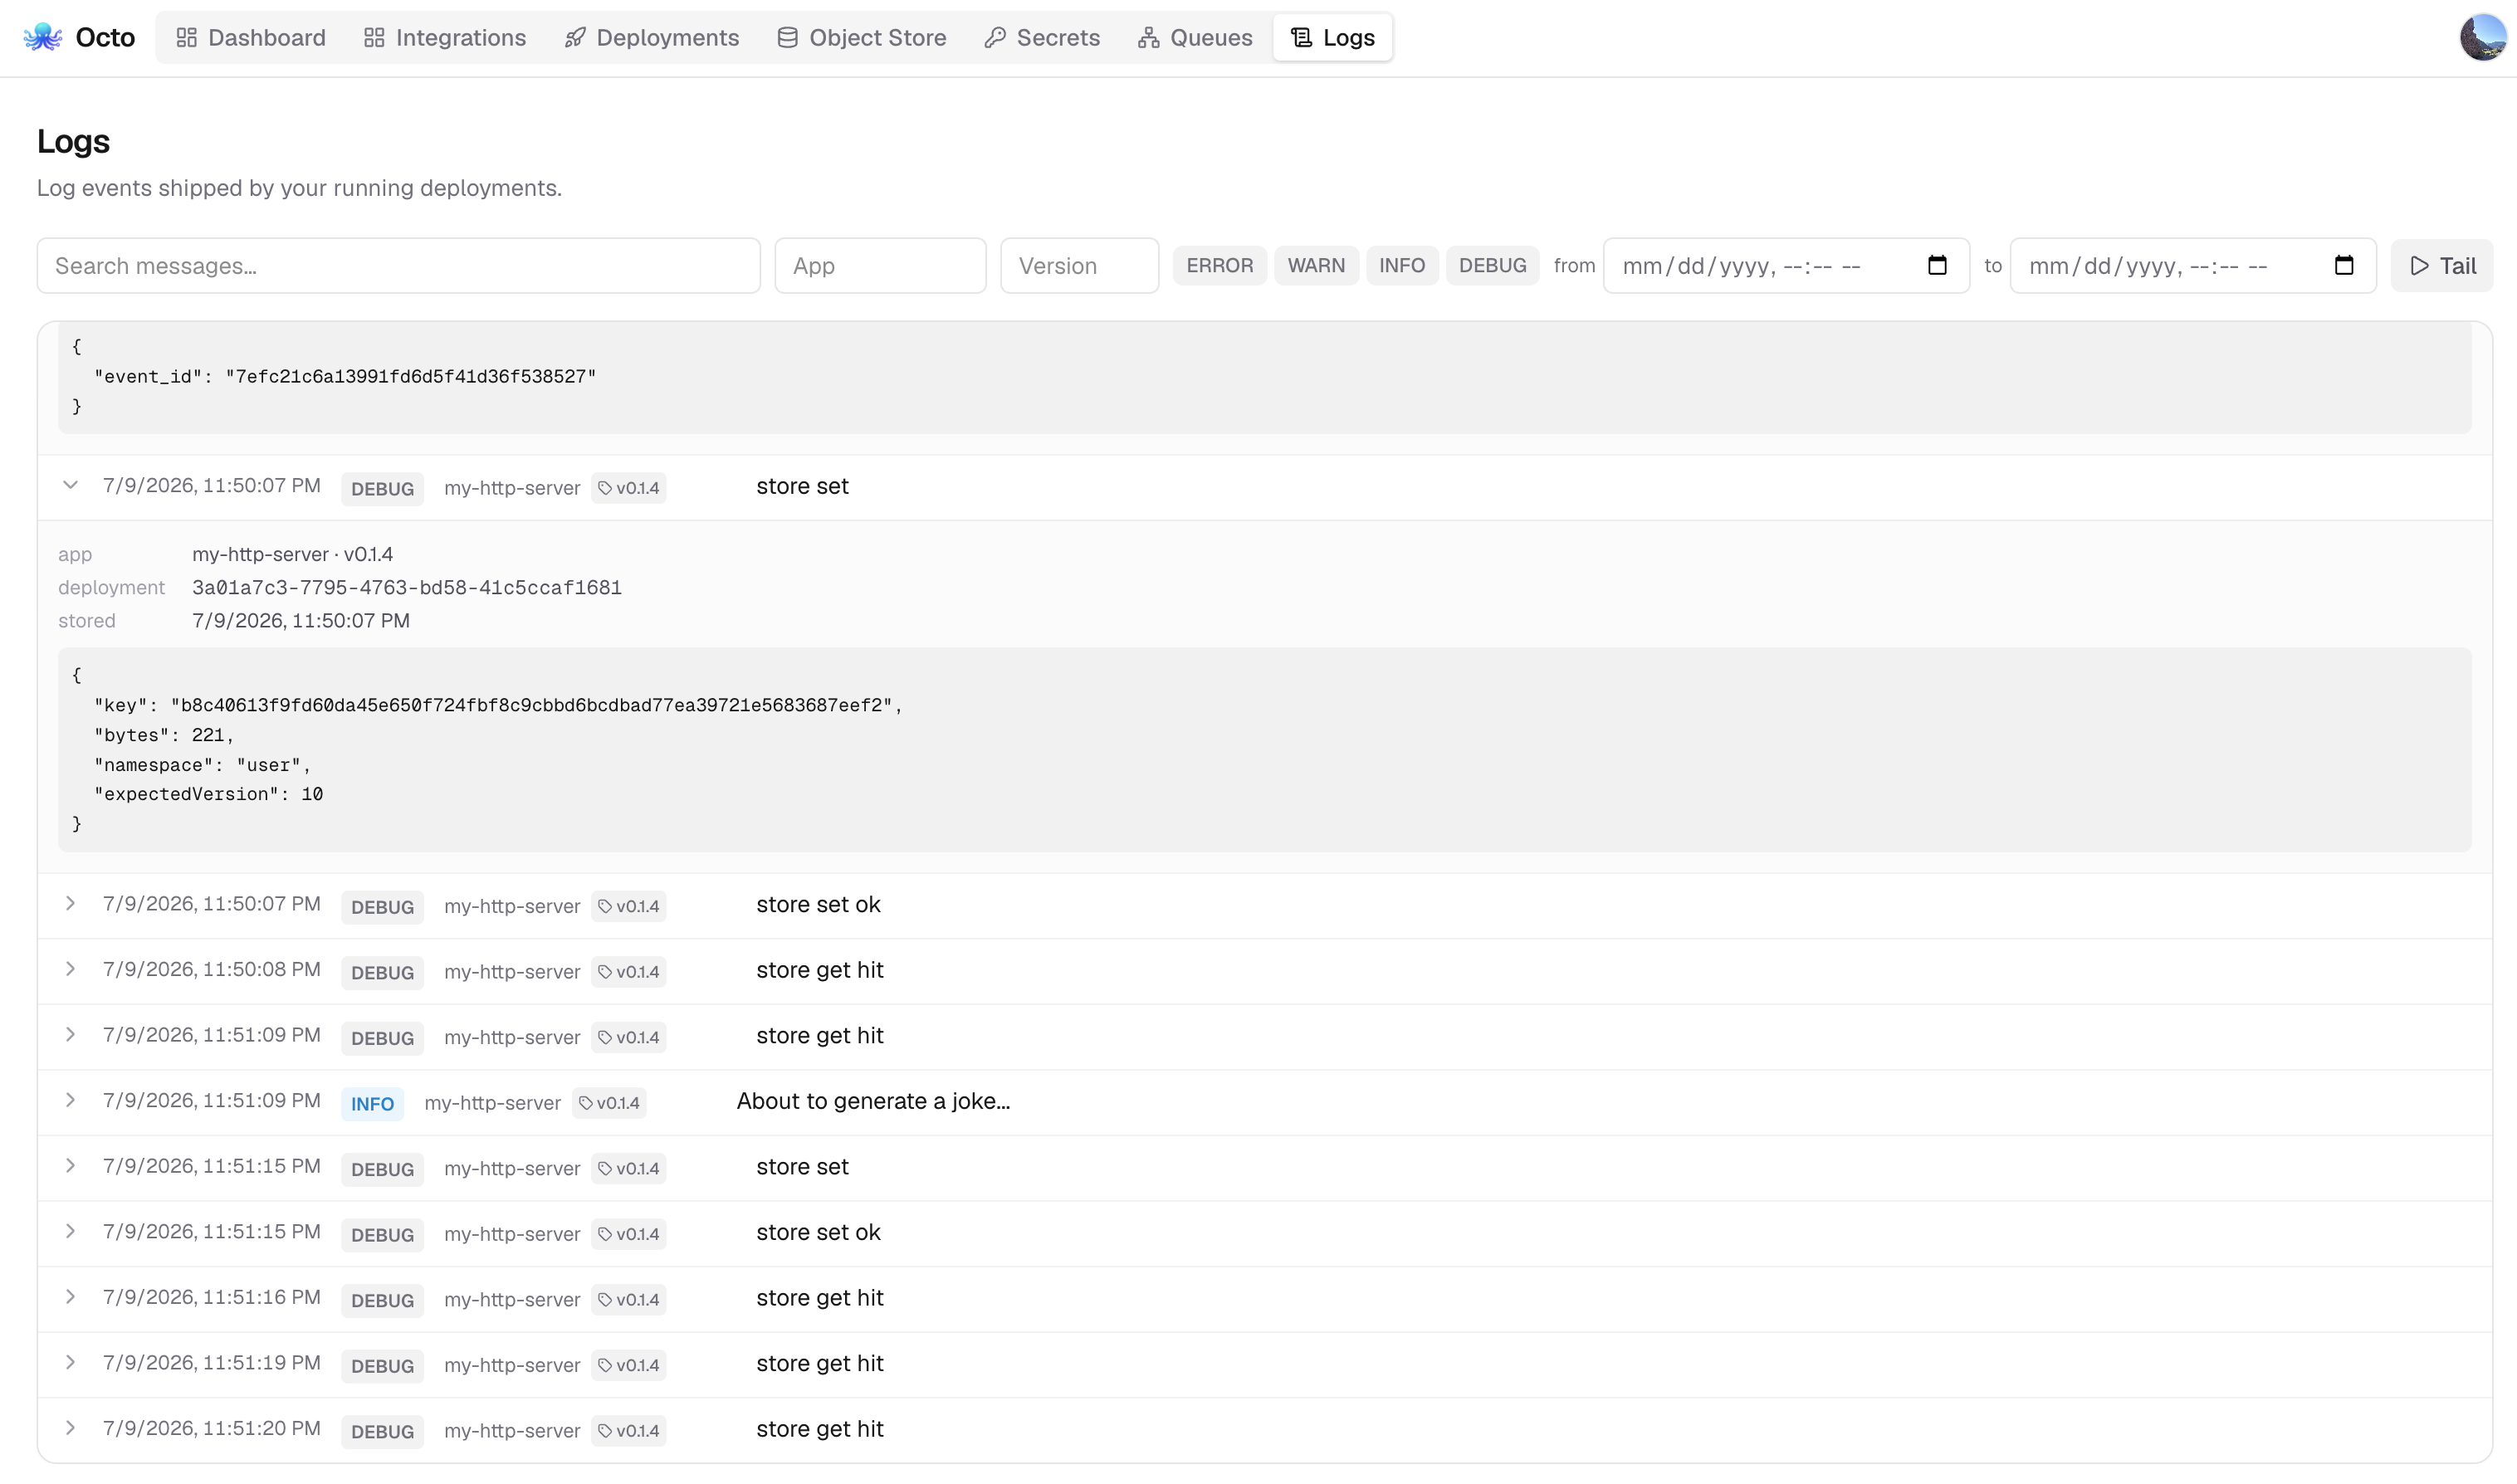
Pair the logs view with deployment status: status tells you a replica is unhealthy; the logs tell you why.