
Debugging Flows
Run one flow with a test input, stop it on any block, and read the message it was carrying.
Run starts your whole integration and waits for real traffic. This page is about the other way to run: invoking a single flow with an input you supply, and stopping it on a block to see the message at that point. The flow runs once and tells you what came out.
The editor is a front-end for octo invoke on the
command line. That guide is the reference for breakpoints, spies, mocks and the
debug config file; this page covers the editor's run and debug panels.
Run a flow
Every flow card carries a ▶ left of its name. Press it and a menu offers the inputs to run with:
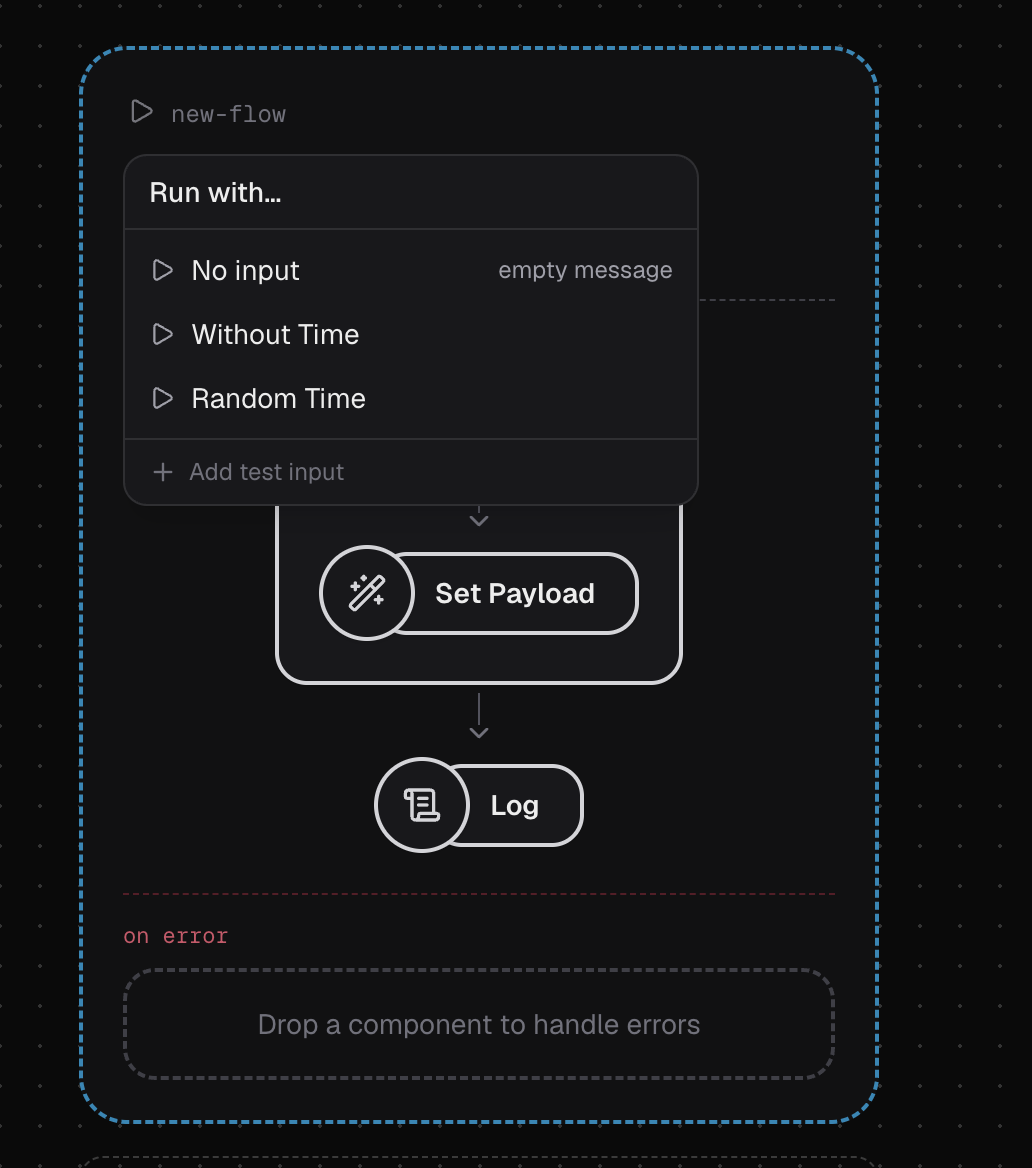
No input runs the flow with an empty message, which is enough for a flow
that builds its own payload but not for one that reads body.orderId. Below
that are the flow's saved test inputs; pick one and the flow runs with it.
The result lands on the console's Output tab, which opens by itself.
Invoking a flow does not start its sources: an HTTP-sourced flow is not served on a port, and a cron-sourced flow does not wait for its schedule. Whatever the source would have put on the message, your test input has to supply.
Test inputs
A test input is a named message: a JSON body, and JSON variables.
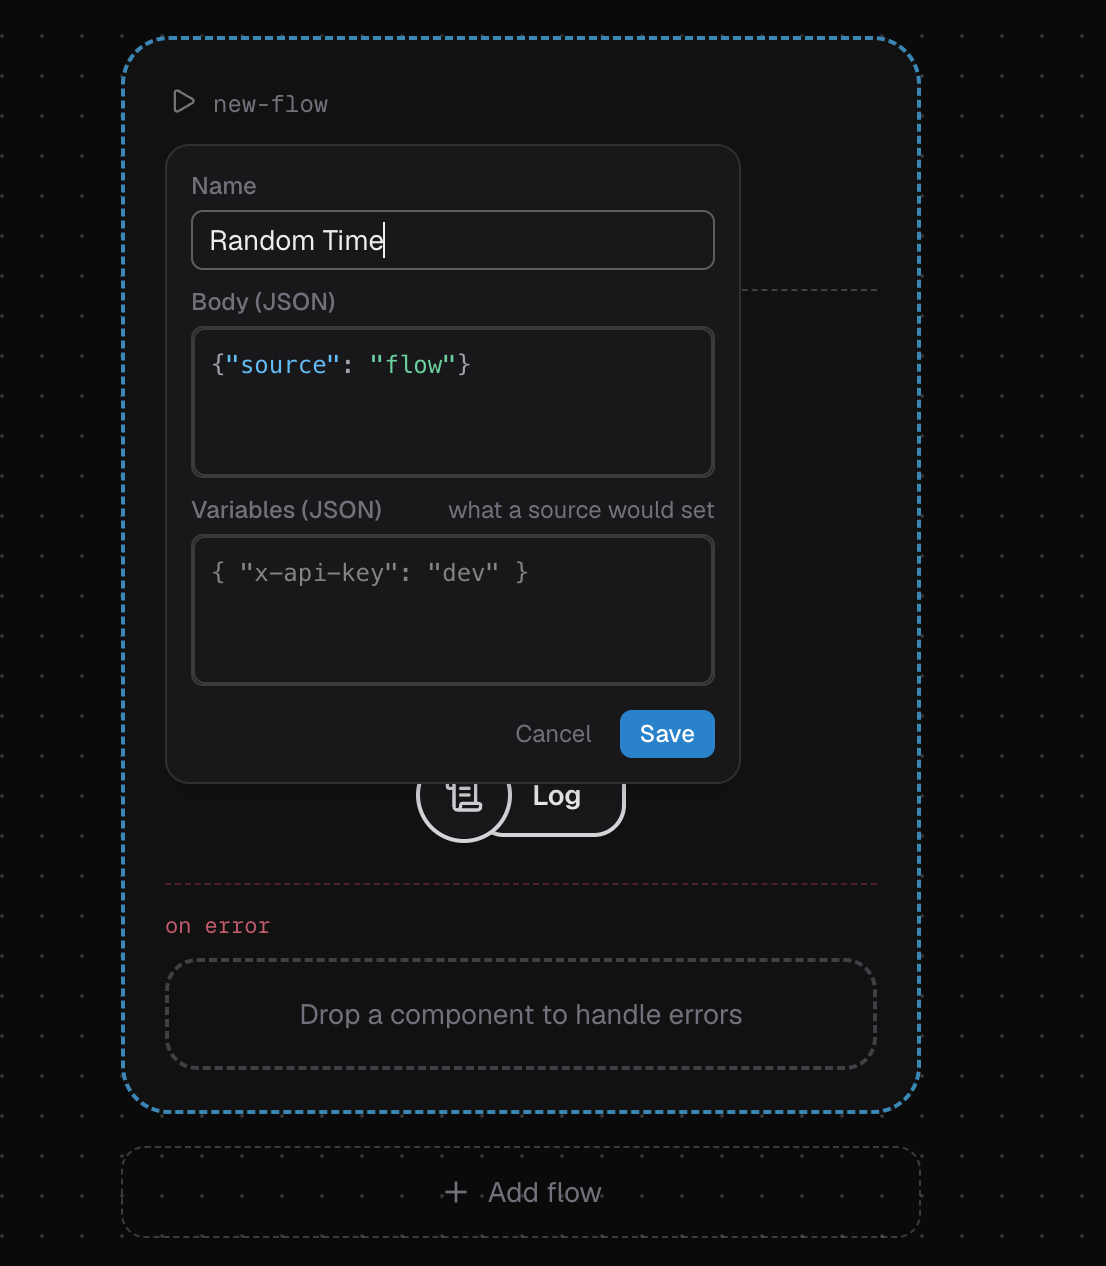
The HTTP source copies request headers into the message's variables, so a flow
that reads vars["x-api-key"] fails with no such key if you only fill in the
body; the variables field stands in for that. Inputs are saved per flow and
survive a reload. Hover a row in the menu to edit or delete it.
An integration you have not saved yet has nowhere to keep its inputs. You can still run it with a scratch input; the menu tells you to save the flow first if you want to keep one.
Where they are stored
Test inputs live in .octo/editor-meta.json, next to your flows:
{
  "version": 1,
  "resources": {
    "orders.yaml": {
      "flows": {
        "orders": {
          "inputs": [
            {
              "id": "3f2a…",
              "name": "large order",
              "data": "{\"orderId\": 42, \"amount\": 250}",
              "vars": "{\"x-api-key\": \"dev-key\"}"
            }
          ]
        }
      }
    }
  }
}
The file is safe to commit: unlike .env.dev,
it holds only the sample messages you typed. Keep secrets out of it; if you must
put one in a variable, .gitignore the file. It never ships, because no flow
declares .octo/editor-meta.json under resources:. The file is keyed by flow
name; rename a flow and its saved inputs, mocks and spies follow.
Why mocking a block can name it
A mock or a spy is
stored against the block's address, the same orders.charge path the
CLI uses. A block is addressed by its name, or by its
type when it has none, so two unnamed log blocks in one chain have no
distinct address. Placing a mock or a spy on such a block gives it a name
(log-2), a real edit to your flow. Rename it whenever you like; the mock
follows.
Run to a block
Hover any block and a cluster of buttons appears in its corner: ▶ to run to it, 🧪 to stand in for it, 👁 to watch it, and ✕ to delete it.
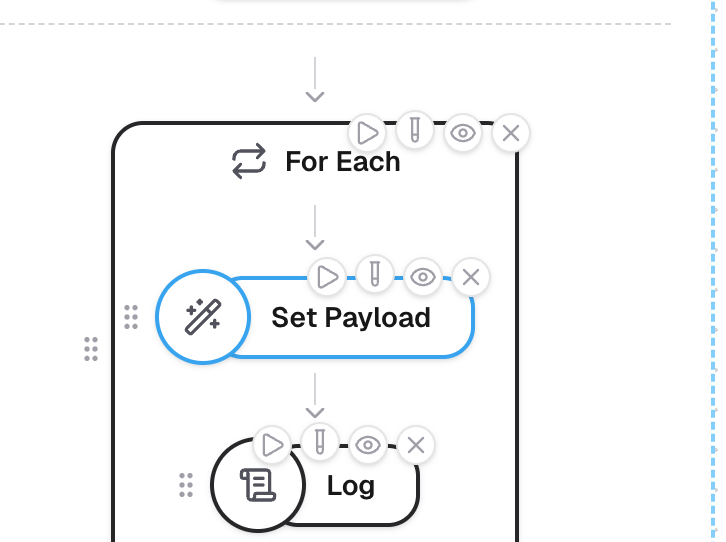
Press ▶ and the flow runs from the top and stops there. Output shows the
message that block was carrying; here, set-payload inside an enrich, with
the date it had just written into the body:
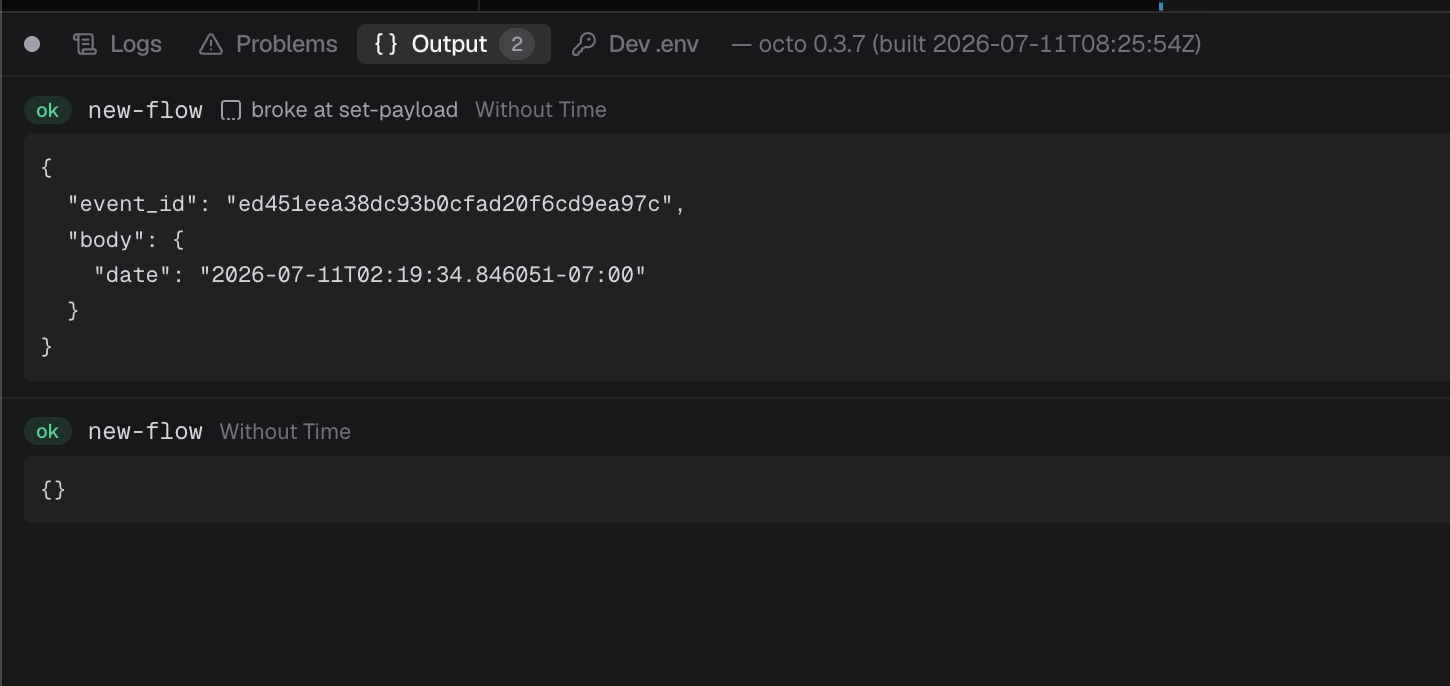
The snapshot is taken after the block runs, so you see what the next block would have received; nothing downstream runs. The run reuses the input the flow was last run with, so you can move the breakpoint without re-picking an input.
"Never reached" is an answer
Put the breakpoint inside an if's else branch, run an input that takes
then, and the result says the block was never reached. That is a normal
outcome: the branch was never taken, so nothing in it could be the bug. If the
flow fails on its way to your block, the error names the block that broke and
goes to Problems.
A block whose position cannot be described unambiguously has no ▶, rather than risk breaking on a different block. This is rare; the editor addresses even unnamed, look-alike blocks on its own.
Stand in for a block
Some blocks you would rather not run: a payment API charges a card, an LLM costs money. The 🧪 button replaces the block for the run, so the real block never executes.
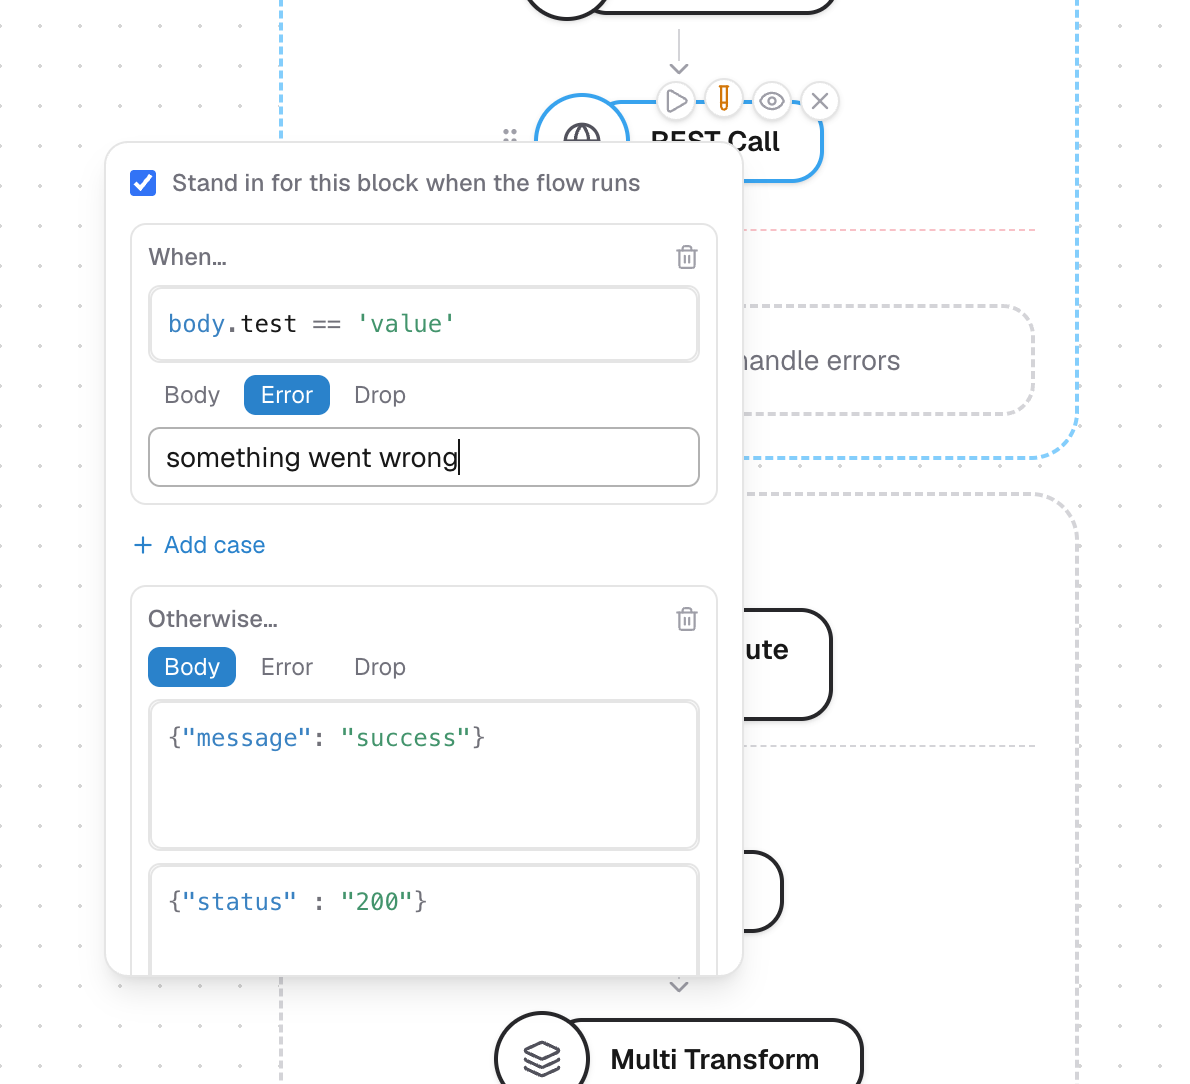
A mock answers with cases, tried in order, each guarded by a CEL condition over the message the block received. Each case does one thing: return a body, fail with an error, or drop the message. An error path needs no broken upstream, only a case that says so:
| When | Outcome |
|---|---|
body.amount > 100 | error: card declined |
| (otherwise) | body: {"charged": true} |
Always give the "otherwise". A mock replaces the block, so a message matching no case fails it rather than falling through. The editor warns you when the default is missing.
A mock stays on the canvas with its button lit until you turn it off; unticking "Stand in for this block" keeps the spec but stops applying it. Every run uses an enabled mock, the flow's ▶ and a block's run-to-here alike.
Watch a block without stopping
The 👁 button records every message that crosses the block without stopping anything and lets the flow run on.
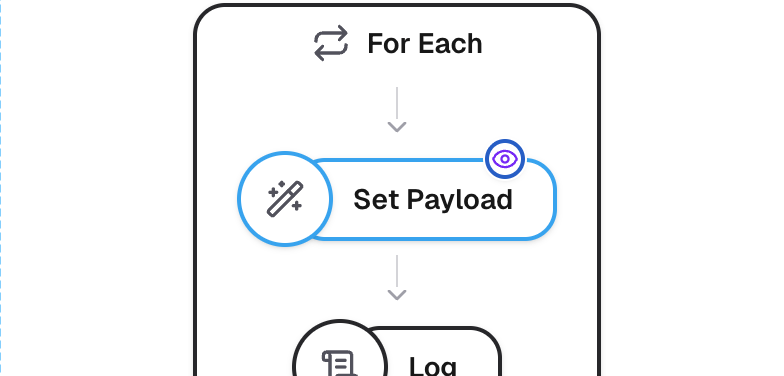
The eye stays lit while the spy is on. A block inside a foreach body or a
fork branch runs once per item, and a spy records every crossing, in order. A
record shows what went in and what came out, including the two outcomes that are
not a message: the block dropped it, or the block failed. Run the flow
and a count appears on the eye; click it to read what it collected, here eight
crossings of a block inside a foreach:
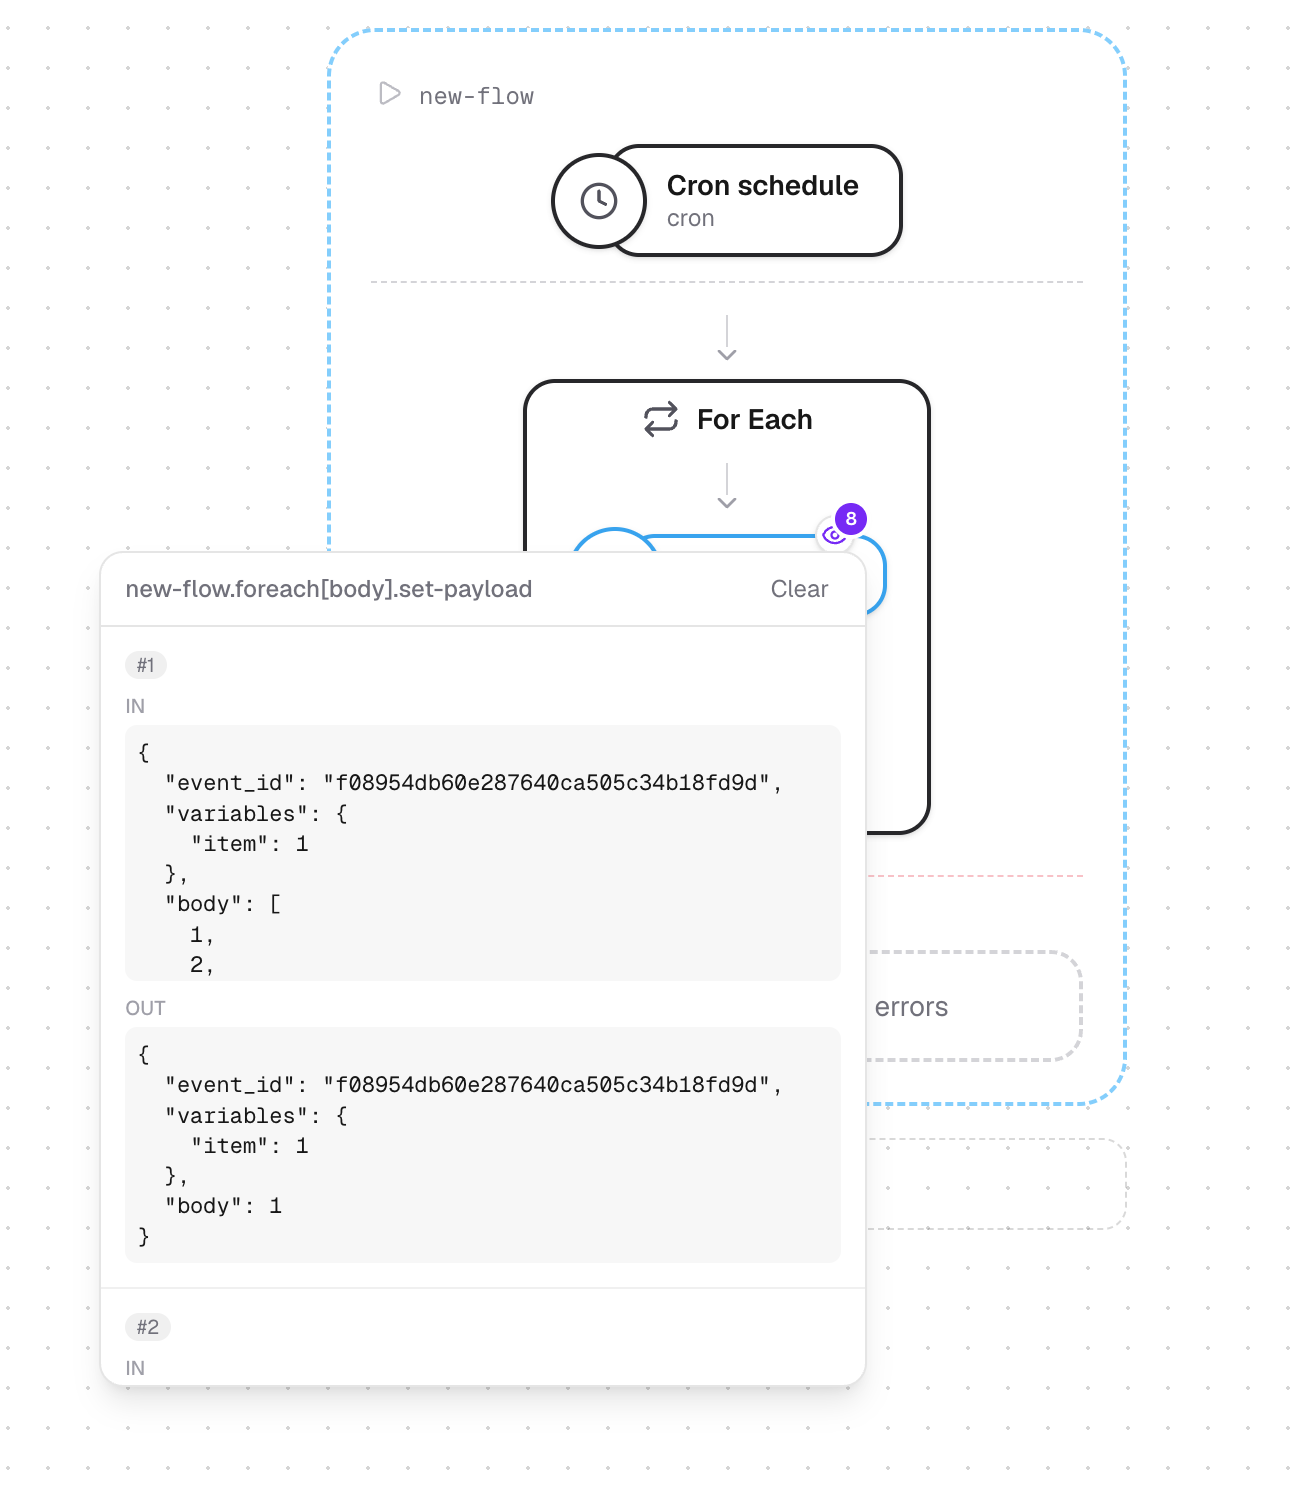
The heading is the block's address, new-flow.foreach[body].set-payload, the
same path --spies takes
on the command line. Records add up across runs and are not reset when you
run again; Clear empties them.
You cannot watch, or break on, a block inside a mocked block: the mock replaced everything under it, so nothing in there can run. The editor says so rather than letting the run fail with a confusing "no such block".
The console
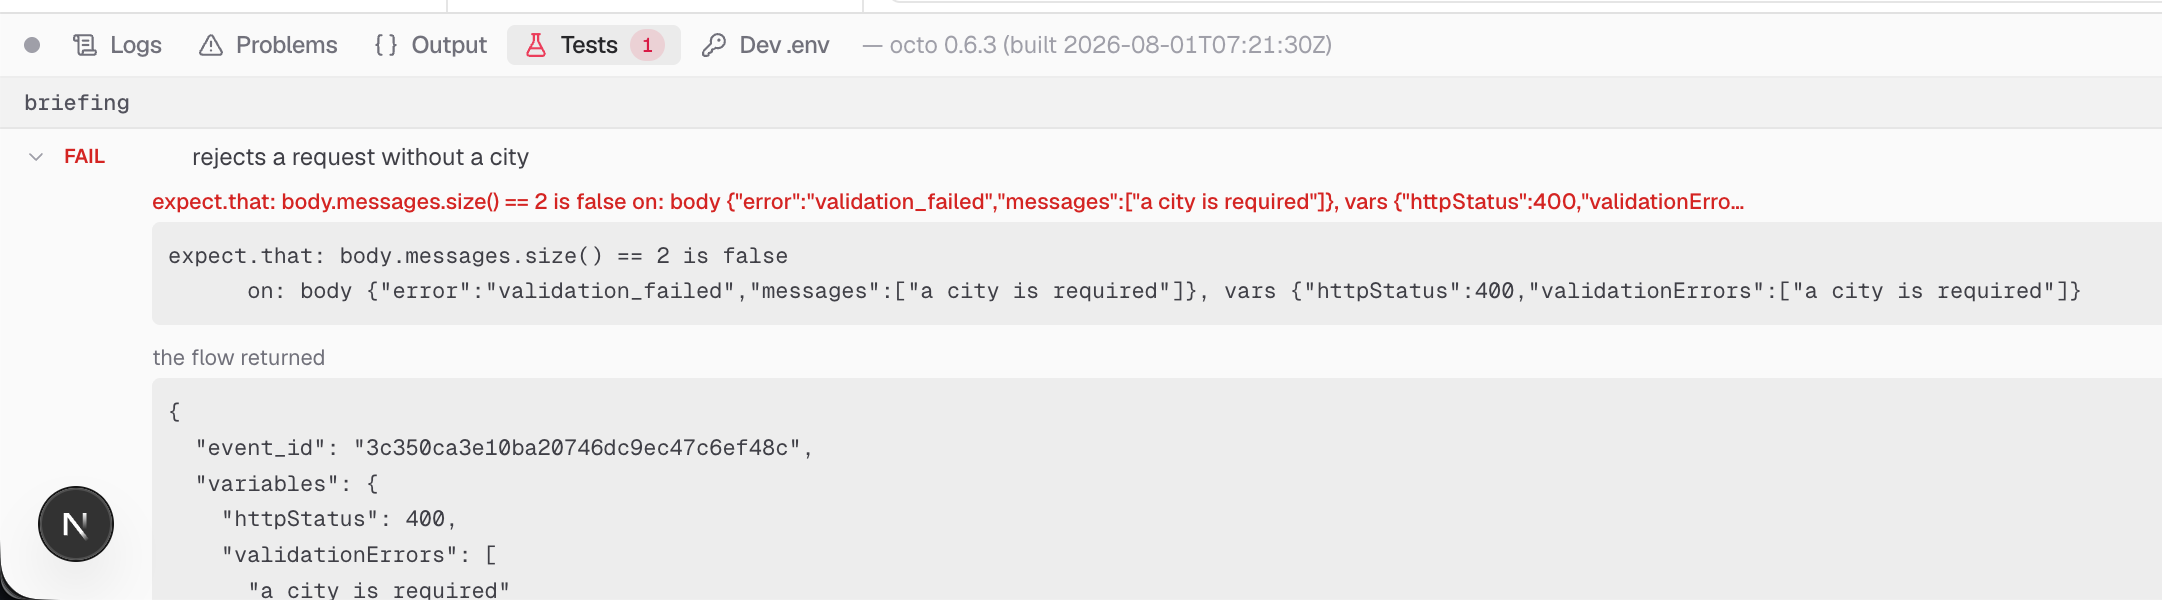
Running a single flow uses two tabs that a full Run does not. Problems holds validation issues (a missing required setting, a connection that points at nothing) and the error from the last failed run; click an issue and the editor selects its block, and the check is continuous. Output holds what your flows produced, newest first: the result of a full run, or the message captured at a breakpoint, with the flow name and the input it ran with. It carries no log lines.
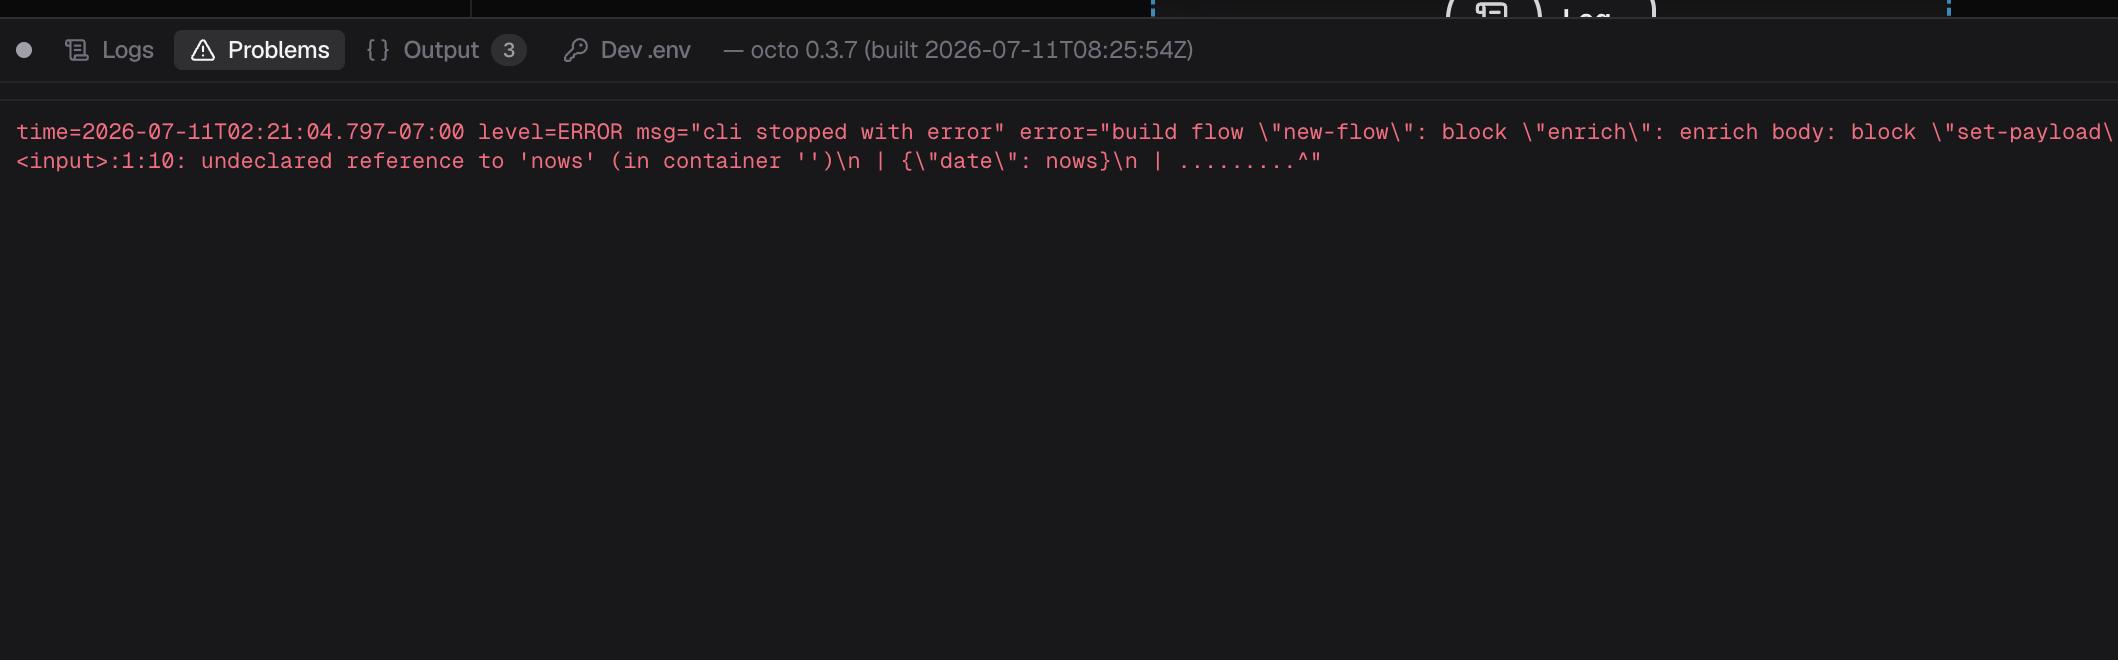
Logs is what the flow said, Output is what it made. A manual run is spawned quietly (errors only), so anything it prints is a problem. A run whose message was filtered (a block returned nothing, so the flow dropped it) is reported as such on Output; like "never reached", it is a result, not an error.
When you need the command line
For the full address grammar (breaking inside a loop body, on the nth case of
a switch, or inside a flow reached through flow-ref) use the CLI, against the
same runtime:
octo invoke --config orders.yaml --flow orders \
  --data '{"orderId": 42}' \
  --break-at 'orders.each-order[body].classify[default].log'
See Debugging a Flow for a worked tour, and the CLI reference for the grammar.
Keeping what you worked out
Everything on this page is scratch. The Testing tab
turns a session into a committed test: the same input and mocks, plus what should
have happened, in a <flow>_test.yaml that CI and dolphin test both run. A
result on the Output tab carries Save as test case to get there in one
step.