
Pod Stats
A sidecar that gives every deployed pod a rolling week of its own metrics in Redis.
The runtime can serve Prometheus metrics, but nothing scrapes them, so when a deployment misbehaved an hour ago there is no record of what it was doing. Pod stats is that record: a sidecar in every deployed pod that samples its own runtime's metrics and writes a rolling week of them to Redis.
It is off by default. Turn it on in the chart:
orchestrator:
  podStats:
    enabled: true
Turning it on rolls every deployment in the namespace once. The runtime container gains OCTO_METRICS=true, because the runtime does not serve /metrics unless asked. Turning it back off rolls them again.
It needs a Redis. With neither redis.enabled nor externalRedis configured, the orchestrator treats the feature as off rather than injecting a container that fails every write.
What it collects
Everything the runtime's admin port serves: every octo_* family, the Go runtime's go_* set, and the process collector's process_* set, which is where a pod's CPU and memory come from. A runtime with one flow exposes about 95 series.
To include per-block timings, bind OCTO_METRICS_BLOCKS on the deployment as you would any other environment variable. This is the one family whose cardinality your own definition controls, so it moves the storage cost below.
Two tiers
| Tier | Holds | At the defaults |
|---|---|---|
live | One row per sample, for one rollup interval | 3600 rows |
rollup | One collapsed row per rollup interval, for the retention window | 168 rows |
A week of one-second samples would be 604,800 rows per pod; a week of hourly rows is 168. The live tier keeps full resolution for the interval in progress; when that interval ends its samples collapse into a single row and a fresh one starts.
Bucket boundaries are aligned to the wall clock (multiples of the interval since the Unix epoch, not since the pod started), so the rows of pods created at different moments line up.
How a bucket collapses
| Kind | Stored as |
|---|---|
| Counter | The delta across the bucket, plus its closing absolute value |
| Gauge | The mean, plus min, max and last |
| Histogram | Each bucket, _sum and _count as counters, so the distribution survives |
| Summary | _sum and _count as counters; quantiles as observed |
Counters store growth rather than a sum of readings because a Prometheus counter is cumulative: octo_flow_messages_total is every message since the process started, so adding up 3600 readings of it would report an hour of traffic roughly 1800 times over. The closing value is kept alongside the delta so consecutive buckets can be stitched back into a cumulative series. A counter that reads lower than the previous sample means the process restarted, and is handled as a reset rather than a negative delta.
Seeing it in the platform
Every card on Deployments carries the last five minutes of the deployment's CPU and memory: a sparkline with the current readings beside it. The two lines are scaled independently, since cores and bytes share no axis. A deployment whose pods are not reporting has no sparkline, which is what an install with the sidecar switched off looks like.
Clicking it opens that deployment's metrics page, which draws the same two metrics properly: CPU against a left axis in cores, memory against a right one in bytes, one line per pod, over anything from the last five minutes to the last week. Comparing the heights of the two lines means nothing, but seeing that a memory climb and a CPU spike began at the same moment is usually the whole question.
The range buttons span both tiers, and the line under the title says which one answered and at what resolution. At the default one-hour bucket, a day of history is twenty-four points, and without being told so a reader takes a coarse chart for a broken one. If the long views look too blocky, the fix is a smaller rollupInterval.
A counter is charted as growth on both tiers, so a rate reads the same whichever one answered. A gap in the scrape is drawn as a gap: the line breaks rather than dropping to zero.
Below the two headline charts, the same page lists every other series the pods report, one card each: the metric's name, what it currently reads, and its shape. Most of the ninety-odd metrics are answered by a number rather than a trend, so the reading is the headline and the chart is what tells you which kind you are looking at.
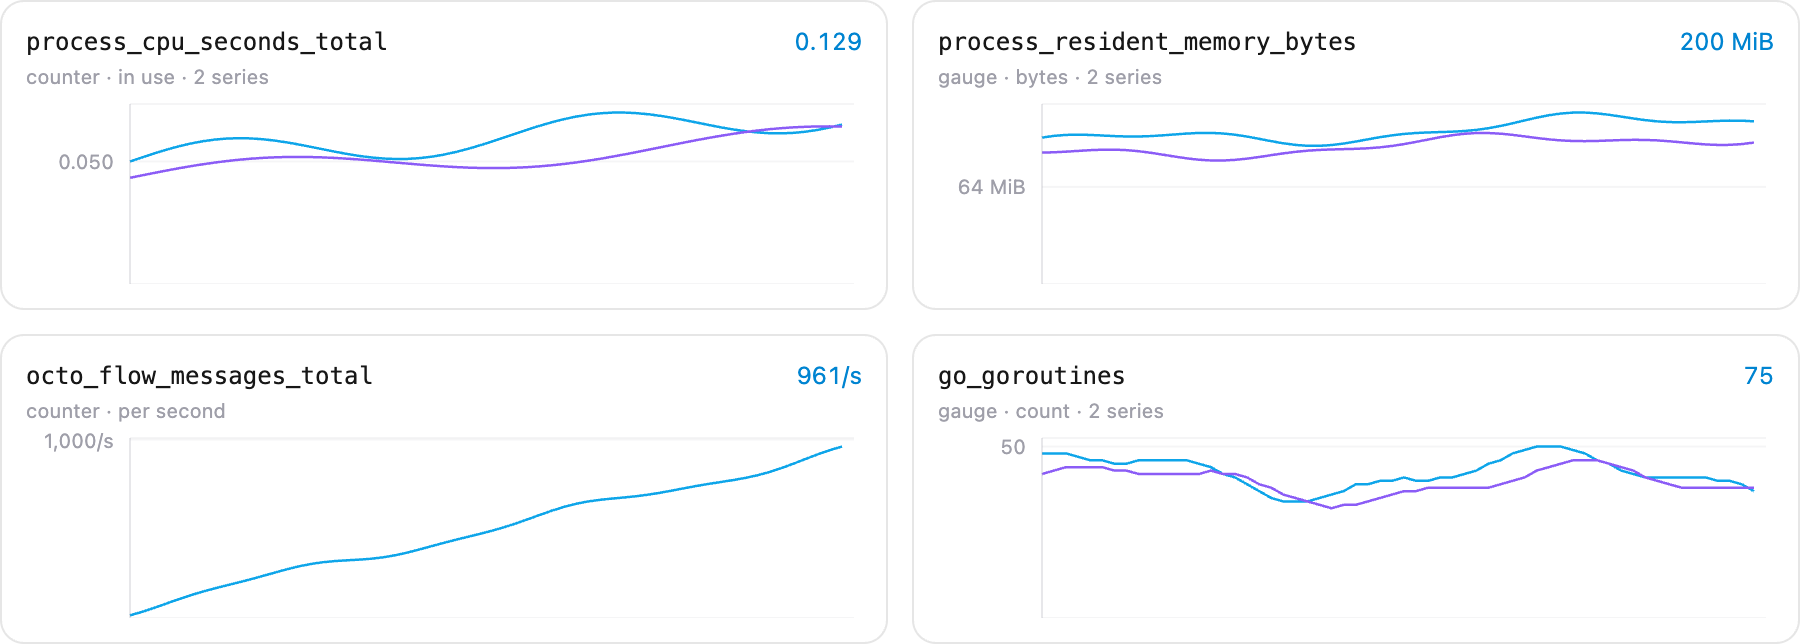
That growth is what octo_flow_messages_total is reading above: messages per second, not a total since the process started.
Settings
| Value | Default | What it does |
|---|---|---|
orchestrator.podStats.enabled | false | Injects the sidecar into every deployment |
orchestrator.podStats.port | 8098 | Where the sidecar serves its probes and /status |
orchestrator.podStats.sampleInterval | 1s | The live tier's resolution |
orchestrator.podStats.rollupInterval | 1h | How wide a history bucket is |
orchestrator.podStats.retention | 168h | How far the history tier reaches back |
rollupInterval is the one worth experimenting with. A week of hourly rows is only 168 per pod, so there is room to go finer: 15m is 672 rows and four times the resolution when you are trying to find when something started. The live tier shrinks to match, since it always holds exactly one bucket's worth of samples.
What it stores
Keys are versioned and deployment-first, so one deployment id finds every pod that ever reported:
octo:stats:v0:{deployment}:pods              ZSET  pod -> last write (unix ms)
octo:stats:v0:{deployment}:{pod}:meta        HASH  the pod's tier configuration
octo:stats:v0:{deployment}:{pod}:dict:{gen}  HASH  index -> series identity
octo:stats:v0:{deployment}:{pod}:live        LIST  newest-first samples
octo:stats:v0:{deployment}:{pod}:rollup      LIST  newest-first collapsed buckets
Reading a deployment means: ZRANGE the pods index, then for each pod LRANGE the tier you want and HGETALL the dictionary generation its rows name. The index score is the time of the last write, so you can tell a live pod from one that stopped reporting without fetching its rows.
Rows are dictionary-encoded. Each series identity (name, labels and kind) is written once into dict:{gen}, and a sample is a flat array of numbers positional to that dictionary; self-describing JSON would be six to ten times larger. When a config reload adds a flow, the dictionary gains entries and its generation advances; indices are only ever appended, so older rows stay readable.
A reading of null is a gap: a series the dictionary knows that the scrape did not report, which is how a removed flow is told apart from one reporting zero. Readings that are not finite are written the same way.
Both tiers are capped lists and every key carries a TTL that is refreshed as it is written. Nothing sweeps up after deleted pods; their data ages out on its own.
Read these back through the pod stats routes on the telemetry service rather than from Redis directly, or through the platform. It does the dictionary join and hands back named, labelled series, and it keeps this layout private: v0 is versioned in the keys so its shape can change. A later version writes under v1 and the v0 keys expire on their own.
What it costs
Measured against a real runtime exposing 95 series, at the defaults:
| One live sample | 534 bytes |
| One rollup bucket | 2171 bytes |
| Per pod | 2.19 MiB |
So ten pods is about 22 MiB of the bundled Redis's 256 MiB, which is why that sizing is unchanged. Series count is what moves the number, so re-measure before assuming it holds after turning on per-block metrics for a busy integration or at a much larger installation.
Checking on it
The sidecar serves a status page on its own port. There is no route to it from outside the pod, so reach it with a port-forward:
kubectl -n octo-dev port-forward <pod> 8098:8098curl -s localhost:8098/statusIt reports scrape and write counts, the last error of each kind, the series count, the dictionary generation and the bucket in progress. A writeErrors count that keeps climbing means Redis is unreachable; a lastScrapeError mentioning metrics means the runtime container was started without --metrics.
What it will not do
The sidecar cannot take a pod out of service. Both of its probes answer 200 whenever the process is running, and the orchestrator gives it a liveness probe only.
It is injected as a native sidecar (a restartable init container), and Kubernetes folds such a container's readiness into the pod's readiness. A readiness probe that told the truth about a Redis outage would pull every integration in the namespace out of its Service, stopping production traffic to protect the collection of statistics. Every failure is counted and logged instead.
It holds no Kubernetes credential and mounts no volume. It speaks to exactly two peers: the runtime on the pod's own loopback, and Redis.