
Traces
How traced runs are stored, how model calls are priced, and the API over both.
A runtime with tracing on publishes a record for every flow and model call it runs, and for the blocks OCTO_TRACING_BLOCKS selects. On the platform those records are consumed off NATS, stored in Postgres, and rolled up per trace, so a run that happened in a pod that has since been replaced can still be read back at the version that produced it, with what its model calls cost.
See Tracing for what the runtime emits and how to switch it on. This page is the other end: what happens to a record after it is published.
Turning it on
Tracing is off unless asked for. Tick Trace this deployment in the deploy or rollout dialog. It is a per-deployment setting, so you switch it on for the one deployment you are investigating rather than for the integration.
On an already-running deployment the switch takes effect through the rollout that carries it: the runtime resolves OCTO_TRACING when it parses its flags, before any config is loaded, so only pods that start with it are traced.
OCTO_TRACING_BODIES and OCTO_TRACING_BLOCKS narrow what is captured. Neither has a dialog of its own, so bind them as env vars on the deployment. They are read from the process environment only, so they too take effect on redeploy rather than on a config write.
Captured bodies and variables are stored as they arrived and are readable by anyone signed in to the platform: there is no per-tenant scoping on traces or logs today. A request body can hold credentials. On a shared cluster, prefer OCTO_TRACING_BODIES=false.
Where records go
Records ship to the internal.traces subject on the shared broker, and the aggregator consumes it as a queue group so each record lands on exactly one replica. Delivery is core NATS, fire-and-forget: at most once, never redelivered. A record that does not arrive is gone, so that tracing cannot back up the flows it observes.
Two consequences matter before you read a trace. The consumer sheds under load: records are batched (500, or every 50 ms) and buffered, and when the writer falls behind new records are dropped rather than queued. The count of what was shed appears in the aggregator's logs and per app in the API.
A publisher that loses records also says so, with a trace.dropped marker naming how many it could not keep. The marker carries no trace id, because it describes the stream rather than any one run, so it can only be reported per app and per window. Nothing can say which traces are incomplete, only that some are.
Replaying the same records twice stores them twice. Records are not de-duplicated; the contract is at-most-once delivery, not exactly-once storage.
What is stored
Two tables. traces holds one row per record, exactly as it arrived: kind, sequence, block path, timing, error, captured body and variables, and for a model call the tokens and the frozen cost. This is what a waterfall is drawn from.
trace_summaries holds one row per trace, upserted as records arrive. The trace list reads from it rather than aggregating the records, which is what keeps the hundredth page as cheap as the first.
Every column of a summary is an order-independent aggregate: a bound, a sum, a ranked maximum, a set union. Records arrive out of sequence order and spread across batches, so the same trace summarizes the same way whatever order its records land in.
The identity columns (which deployment, which app version, what started the trace) are chosen rather than merged. Each batch reports how well its best record named the trace, where a source.receive beats a source.emit beats a flow.started, and the stored row remembers the rank it was written with, so a worse later record cannot overwrite a better one.
Timing
A record is stamped when the thing it describes finished, so it occupies [ts − duration_ns, ts]. A trace's started_at is the minimum of those interval starts, which is the same rule a waterfall applies, so the duration the list reports and the span a chart draws are the same number.
seq is gapless across a process, not within a trace, so one trace's records are normally non-consecutive. A gap in a trace's sequence numbers is never evidence of loss.
Folded runs
A streaming block is an ordinary block, so the engine emits a block.pre-invoke
and a block.post-invoke for every frame it writes, which for an agent
streaming an answer is every token. One conversation with the platform agent
produced a single trace of 26,508 records.
So the aggregator collapses a run of near-identical records into one row, and
says so under attrs.folded:
{ "folded": { "count": 1204, "firstSeq": 8801, "lastSeq": 11208 } }The row keeps the first record's identity (its sequence, event id, block
path and flow) so a folded span nests exactly where the unfolded ones did. Its
interval covers the whole run, beginning where the first record began and ending
at the last one's stamp. The waterfall names it sse-event ×1204.
Where the payloads allow it, they are joined back together, so the body of a
folded row is the streamed answer as prose rather than one word of it. When the
payload field is not one the aggregator recognises the row says
"bodies": "first", and the body is the first record's alone; past 32 KiB it
stops merging and sets truncated, the same flag the runtime sets when it drops
a payload of its own.
A run ends when what is streaming changes, which the fields beside the text report, or when nothing has arrived for a second. Finished runs are collected twice a second, so a folded row reaches the table within about a second and a half of the stream going quiet. Runs shorter than four records are stored unfolded.
Two consequences follow. A records count on a summary is the number of rows the
detail view will show, which after a fold is fewer than the number of things that
happened; the count inside attrs.folded is the second number. And a block record
is held for up to a second before it is stored, because a run cannot be recognised
from its first record.
Folding is only applied to the two block kinds. Everything else is one record per event already.
Versions
Every record carries the app_name and app_version stamped by the pod that emitted it. A trace keeps the version that produced it across a rollout, and the app list reports one row per (deployment, name, version), so a cost belongs to the release that incurred it rather than to whichever release is current.
Traces that cross apps
A trace id rides on the message and survives a queue or topic hop, so a flow that dispatches to another integration keeps the same trace. deployment_id on the summary is the deployment that entered the trace; deployment_ids accumulates every deployment that contributed records.
Reading the chart
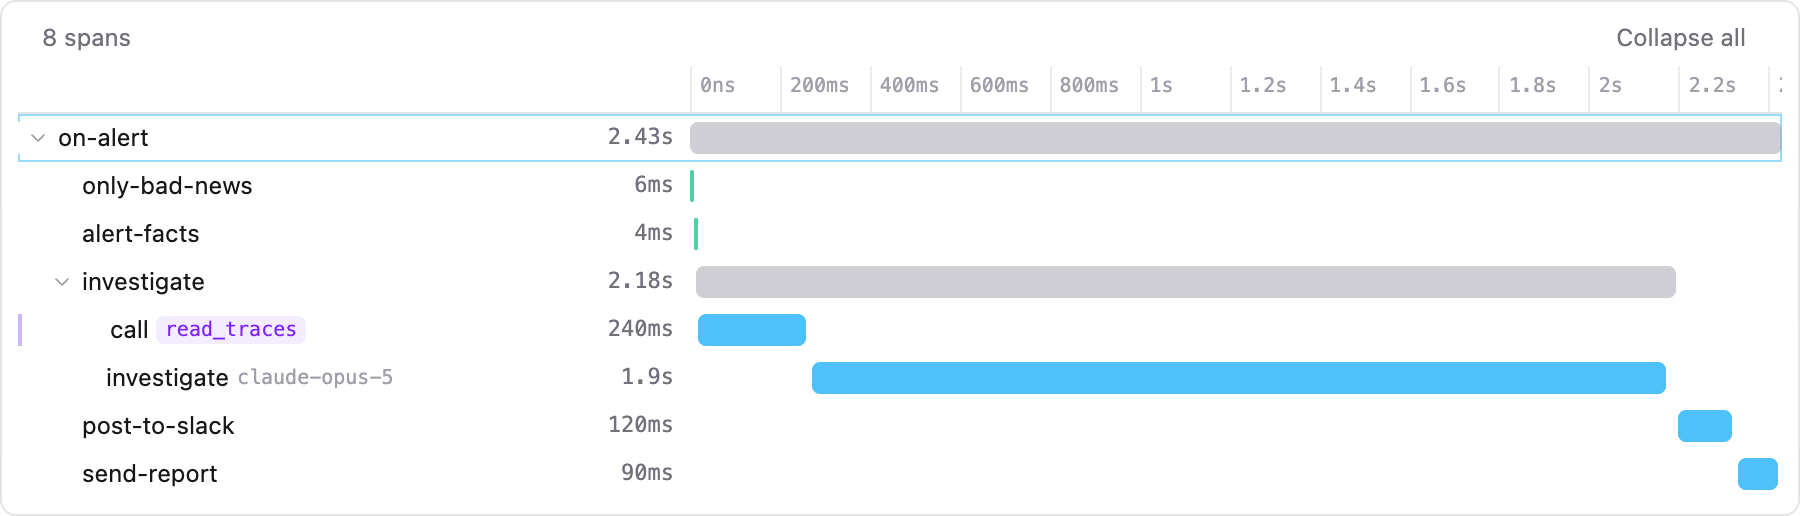
A trace's waterfall draws time at a constant scale, a fixed number of pixels per second, rather than stretching each trace to the width available. A long execution is a long chart that scrolls sideways, and a ten-second trace is drawn ten times as wide as a one-second one, so two traces can be compared by looking at them.
A trace too short to fill the window still fills it, as a floor rather than a second mode. The name and duration stay pinned to the left edge while the track scrolls. Scroll or swipe to pan, hold a modifier and use the wheel to zoom about the cursor, drag a range on the ruler to zoom into it, and press Esc (or Fit) to bring the whole trace back.
What a row says
A model call names the model that served it, beside the block's own name. The trace summary lists every model the trace used rather than hiding them in a tooltip.
A span that ran inside an agent tool call is marked, and the first row of each
tool names it. This is derived, not recorded: there is no tool trace kind and no
tool attribute. The runtime builds each of an agent's tools as a branch of the
agent block, so orders.assistant[search_docs].fetch is what a tool call looks
like on the wire, and the mark is read back out of that path. A path it cannot
read is left unmarked rather than guessed at.
The bar's colour is unrelated to that mark. Colour says where the time went: waiting on something outside the process, running inside it, or holding work that ran under it.
Reading tokens
Every model call reports five counts, and three of them are shown wherever a trace is.
A trace list row carries the model-call count and the split beside it, 12.4k in · 830 out. A trace that is nearly all input is a prompt problem; one that is nearly all output is a generation problem.
The detail panel shows the total and the same split under it, plus cache reads when there were any.
Open a model-call record for the rest: thinking tokens, cache reads and cache writes, per call.
The figures obey the two arithmetic rules in Token arithmetic: output already includes thinking tokens, and cache reads and writes are counted apart. The panel says so on hover, and the record inspector says "N of it thinking" rather than listing thinking as a peer of output.
Pricing model calls
Pricing happens once, at ingest. The cost is stored frozen alongside the id of the rate that produced it, so a price change next month cannot restate what last month cost.
The runtime knows no rate card and computes no price, but it does relay one number it is given: some providers say what they charged. OpenRouter returns the amount it billed on every completion, which includes the per-request and per-image charges a token-keyed rate card structurally misses. Such a call is stored with that cost and cost_status = 'reported', and no rate is consulted. Everything else is priced from a card below.
Rates come from two published catalogues, consulted in order. OpenRouter's model list leads: it is priced per model by the platform that sells them and turns over daily. Helicone's follows, because it carries the patterns OpenRouter never publishes, such as Bedrock, Azure and vendor-hosted ids. A call is priced by the first card that has a rate for its model.
The fallthrough is narrow on purpose. Only "this card has never heard of this model" moves to the next one; a partial pricing is a real cost from a real rate and stays, and a call whose provider reported no tokens is not a question a second card can answer differently.
Each card is stored and diffed under its own source, and both are kept as history in llm_prices. A changed price closes the old row and opens a new one, an unchanged price is a no-op, and a model that disappears from the feed is left open rather than closed, so a missing catalogue entry cannot retroactively unprice stored history. Every refresh of every source, successful or not, is recorded in llm_price_syncs.
Neither feed needs an API key. OpenRouter's model list is public, so pricing from it costs no credential and no chart secret.
One OpenRouter entry prices a model twice over: once under its full routed id (anthropic/claude-sonnet-4.5), and once as a prefix of the vendor's own id (claude-sonnet-4-5-20250929), because those are different namespaces for the same model. A model the feed prices as variable (the auto-router publishes -1 for every field) is refused rather than stored at zero, since a zero rate would report every call it matched as free.
The card is loaded from the database before anything is consumed and refreshed in the background afterwards, so a slow or unreachable feed does not stop the service pricing.
Unpriced is not free
Every priced record carries a cost_status beside its cost, and a consumer has to read it to know what a NULL means:
cost_status | Meaning |
|---|---|
'' | Not a model call. |
reported | The provider said what it charged. Not an estimate, and no rate produced it, so price_id is NULL. The most certain of these, not the least. |
priced | Fully priced from a known rate. |
priced_partial | Priced, but the card published no cache rate, so cached tokens were charged at the input rate: an over-estimate that says so. |
unpriced_model | The model is in no rate card. The cost is unknown, not zero. |
no_usage | The provider reported no token usage. There is nothing to price, which is different from pricing it at nothing. |
A reported cost is a known cost: it sums into every total and is never counted as unpriced.
Aggregates carry the same pairing: cost_usd sums only what could be priced, and unpriced_calls counts what could not. A total is a lower bound whenever unpriced_calls is non-zero, and a reader holding only the total has no way to know that.
Token arithmetic
Three rules the connectors normalize and this service depends on.
output_tokens already includes thinking_tokens. Adding them bills reasoning twice.
cached_tokens is cache reads. Anthropic reports an input count that excludes them; OpenAI and Gemini report one that includes them. The cost formula keys on attrs.provider, the vendor family the runtime stamped on the call, rather than on the provider of whichever rate matched the model, because bare claude-* patterns are also published under BEDROCK and AWS. A record carrying no provider, meaning anything stored before the runtime stamped one, falls back to the matched rate's provider, so historical figures are unchanged.
cache_write_tokens is cache creation, and is charged separately. It bills above the input rate (Anthropic's published figure is roughly 1.25x) where a read bills below it, so the two are stored and priced apart rather than summed. Only Anthropic reports a write count; the others leave it null. It is null on records written before the runtime reported the count: unknown, not zero.
priced_partial means the rate card published no rate for one of the cache halves and those tokens were charged at the input rate instead. Which way that errs depends on the half: a read costs less than input, so the fallback over-states; a write costs more, so the fallback under-states. No multiplier is invented in either case, so the status is the signal that the number is an estimate.
trace_summaries rolls up input_tokens, output_tokens, cached_tokens and thinking_tokens per trace, alongside llm_calls, cost_usd, unpriced_calls and models. The summary's thinking_tokens is reporting only and never reaches a cost, because output_tokens already includes it and cost_usd is computed without it. There is no cache_write_tokens column on the summary: cost_usd already carries the write cost into the aggregate.
The API
Served by the observability service on the same port and OBSERVABILITY_URL as the log query API. Responses are snake_case; the platform client maps them.
| Route | Purpose |
|---|---|
GET /traces/apps | One row per app with activity in a window: trace and failure counts, cost, unpriced calls, dropped records. from/to default to the last 24 hours and are echoed back. |
GET /traces | One page of traces. Filters: deploymentId, integrationId, appName, appVersion, flow, status (repeatable), minDurationMs, hasLlm, q, from, to. |
GET /traces/{traceId} | One trace: its stored summary, its records ordered by seq, and a truncated flag. ?bodies=0 omits the captured payloads. |
GET /traces/{traceId}/records/{id} | One record's body and variables, for click-to-inspect after loading a trace with bodies=0. |
Paging is keyset, and the cursor is a pair, <rfc3339nano>|<traceId>, returned as next_before and passed back as ?before=. It is a pair because traces tie: a burst of requests starts many of them inside the same microsecond, and a cursor on the timestamp alone either skips the rows that tie across a page boundary or serves them twice.
A trace's detail response is capped at 20 000 records with truncated: true. The cap is reported rather than silently applied, because a waterfall drawn from a cut record set is wrong in a way nothing in the picture reveals. Streaming used to reach this cap on its own; folded runs are why it no longer does.
The summary in the detail response is the stored rollup, not one recomputed from the records beneath it, so the number in the list and the number in the detail panel cannot disagree.
Configuration
The aggregator needs DATABASE_URL and NATS_URL; without either it still serves /healthz.
It also needs REDIS_URL, and refuses to start without one, because that is where an open run is held while it is being folded. The chart supplies it (see Redis) and fails while rendering if you turn Redis off without pointing externalRedis.url somewhere.
Two optional settings tune pricing:
| Variable | Helm value | Default |
|---|---|---|
LLM_PRICES_SOURCES | logs.prices.sources | openrouter,helicone |
LLM_PRICES_URL | logs.prices.url | Helicone's public catalogue |
LLM_PRICES_OPENROUTER_URL | logs.prices.openrouterUrl | OpenRouter's public model list |
LLM_PRICES_REFRESH | logs.prices.refreshInterval | 12h |
LLM_PRICES_SOURCES is a comma-separated list in preference order; name one source to use only it. An unknown name is warned about and skipped rather than fatal, and a value naming nothing usable falls back to the default.
Point either URL at a mirror for a cluster without egress. A cluster that can reach neither still serves whatever rates are already stored and records the failure in llm_price_syncs.
Retention
traces and trace_summaries are pruned by the site's data retention policy. Set it at /platform/admin/retention; traces get their own window, separate from the one for logs. The policy defaults to keeping everything, so until you set one these tables grow without bound exactly as before. For the routes behind the page, see the observability API reference.
Traces usually want the shorter of the two windows. A ten-block flow emits roughly two dozen records and each can carry a captured body, so a day of tracing costs far more than a day of logs.
A trace is deleted whole. The unit of retention is the summary, and a trace's records go with it, so a swept trace never becomes one that appears in the list but cannot be opened. Pruning each table on its own timestamp would strand the late records of a trace that straddles the boundary, since the two sit on different clocks.
Dropped-record markers are collected too. They carry no trace id, so they never appear in trace_summaries and a by-trace sweep alone would never reach them.
llm_prices and llm_price_syncs are never pruned. A stored cost points at the rate that produced it, and expiring rate history would unprice traces that are still inside their window.
Until you set a policy, nothing is deleted. Watch the table sizes on a busy cluster, set a window that suits it, and switch tracing off for integrations you are not actively investigating. Retention bounds the growth, it does not slow it.
Both consumers join queue groups, so extra logs replicas share each stream rather than each storing every record. A trace's records may be split across replicas, and the halves still merge to the same answer: every summary column is an order-independent aggregate, and the upserts are issued in trace-id order.