
Alerting
Watches: standing questions about your telemetry, evaluated on a schedule, that tell somebody when the answer changes.
Alerting turns a question about a log line, a trace or a pod's memory into a standing one: a watch is asked on a fixed interval, and when the answer changes it tells somebody. Because the alerts that matter are usually about change ("the error rate for this integration jumped"), watches can also detect change against the series' own recent history, with enough statistical care that a quiet integration going from one request to three does not wake anybody.
What a watch is
One schedule, a set of conditions, and what to do when they hold.
conditions ── all / any ──▶ verdict ── held for `for` ──▶ firing ──▶ actionsA watch has between one and ten conditions, combined with all or any. The schedule is one interval for the whole set, plus for: how long the combined verdict must hold before the watch fires. Actions are what happens then: publish to a topic, or send an email. Conditions may read different sources, so "error rate up and memory above 1.5 GB" is one watch.
for applies to the combined verdict, not to each condition. Per-condition clocks would let two clauses each be satisfied for five minutes in non-overlapping stretches, with the conjunction never once true, and fire; nobody who wrote "A and B for 5m" meant that.
Sources and metrics
| Source | Metric | Aggregates | What it is |
|---|---|---|---|
traces | traces | count | traces started |
traces | failed_traces | count | traces whose status is not ok |
traces | error_rate | ratio | failed ÷ total |
traces | duration_ns | p95, avg, max | how long a trace took |
traces | cost_usd | sum | what the model calls cost |
traces | tokens, llm_calls, unpriced_calls | sum | model-call accounting |
logs | events | count | log records |
logs | error_rate | ratio | error and fatal ÷ all levels |
pod_stats | any exported metric | max, avg, sum, min | what the stats sidecar recorded |
The trace and log catalogues are closed. Pod-stat metric names are whatever the runtime exports, and you find them with GET /stats/{deploymentId}/metrics.
A scope narrows the rows: a deployment, an integration, an app name or version; for logs also levels and a message substring; for pod stats a set of pods or labels.
A log condition with a message search must name a deployment or an app. Unbounded, a substring filter is a sequential scan of every log line on the installation, once a minute, forever. It is refused when you save the watch.
Condition kinds
threshold
Is this number above (or below) that one, over a window.
{
  "id": "c_1", "type": "threshold",
  "source": "traces", "metric": "error_rate",
  "scope": { "appName": "checkout" },
  "params": { "op": "gt", "threshold": 0.05, "windowBuckets": 15 }
}
For a ratio the comparison is made against the Wilson score bound rather than the raw proportion. One failure out of two traces is a 50% error rate by the point estimate; the bound at two trials is about 9%, so a 10% threshold does not fire on it, while at four hundred trials the bound is about 45% and does. The number reported is still the plain proportion.
windowBuckets is the whole of the smoothing: five one-minute buckets is a five-minute rate, with no phase lag and no invented points.
spike
Has this number suddenly changed, judged against its own recent history.
{
  "id": "c_2", "type": "spike",
  "source": "traces", "metric": "traces",
  "params": { "direction": "up", "baselineBuckets": 30, "z": 4, "minDelta": 5, "minRatio": 2 }
}
The baseline is the median of the window aggregate over baselineBuckets, and the spread is its median absolute deviation, with a guard band held open between the baseline and the observation. Three gates must all clear:
| Gate | Asks | Default |
|---|---|---|
z | is the change large relative to how much this series usually moves | 4 |
minDelta | is it large in absolute terms | 5 for counting metrics, otherwise none |
minRatio | is it large in proportion | 2 (doubled) |
Over a quiet enough history a z-score will eventually call any change significant; minDelta is what says two more requests do not matter. A series idling at one request a minute that goes to three clears neither gate; the same series going to sixty clears all three. Median and MAD rather than a moving average, because an average absorbs the incident and the alert argues itself down mid-outage. guardBuckets (default 1) keeps a gap between the baseline and the observation; without it a gradual ramp supplies its own baseline and never registers.
absence
This used to report and has stopped.
{
  "id": "c_3", "type": "absence",
  "source": "traces", "metric": "traces",
  "scope": { "deploymentId": "..." },
  "params": { "forBuckets": 5, "minBaseline": 12 }
}
It is its own kind rather than "count below one" because zero and unknown are different states, and because it needs a precondition a threshold has nowhere to put: the series must have reported before it went quiet. Without that, a watch on a deployment that never ran fires forever.
What a gap means
A bucket with no rows is counted as zero only where absence is itself a recorded observation.
| Metric | An empty bucket means | Read as |
|---|---|---|
| trace and log counts and sums | nothing happened; the table records everything | 0 |
| averages, percentiles, every ratio | undefined over zero rows | unknown |
| pod stats, any aggregate | the sidecar did not report | unknown |
"No traces ran" is not "0% of them failed", and reporting it as zero would satisfy every downward condition on the platform. Nothing is interpolated across a gap.
A condition that could not be decided leaves the watch's state alone. It does not advance a hold, and it never resolves an open incident, so an outage is not marked fixed because the pipeline stopped reporting.
Before each pass the evaluator asks one shared question: has anything at all arrived recently. If nothing has, watches that fire on an absence are skipped rather than evaluated. A dead ingest pipeline looks exactly like an idle installation, and without this query a broken consumer would page you about every deployment at once.
Firing, resolving, and not flapping
The hold is counted in evaluations, not wall-clock seconds: five minutes of firing with an evaluation missing in the middle is not five minutes of firing. Resolving takes two consecutive clean evaluations, because a metric hovering at its threshold would otherwise open and resolve an incident every minute. An episode that stops being decidable for long enough closes as stale, which stays distinct from resolved everywhere it is recorded. Editing anything that changes what a pending hold means (a condition, the combinator, the hold) restarts it; renaming a watch or changing its recipients does not.
Mute suppresses notifications for a while without stopping evaluation, so the history stays complete and an open incident still resolves on its own. To stop a watch entirely, disable it, which also closes whatever it had open.
The cooldown
A cooldown keeps a watch quiet for a while after it has announced something. It is the only thing that bounds how often a watch reports, and it bounds it the same way whether the alert is still the same episode or a new one.
A still-firing watch offers to say so on every evaluation, and there is no separate repeat interval: one number decides, across episodes too, so a watch that resolves and fires again ten minutes later stays quiet. When the receiver is slow on purpose (a person, or an agent working the problem), being told again because the metric flapped is being told to start over.
{ "cooldown_seconds": 1800 }It suppresses the announcement, not the work: the check still runs, the evaluation is recorded, and the incident still opens and closes. Only the message is withheld, and only for the two kinds that start or repeat a claim. A recovery is never suppressed.
The editor defaults to fifteen minutes; a definition posted to the API without cooldown_seconds gets zero, which lets every announcement through, one per evaluation. That is a real setting if the receiver is a machine that wants each one.
The cooldown record is the one piece of alerting state kept in Redis rather than Postgres, because it is disposable: losing it means somebody is told twice. Losing what is in Postgres would restart a hold mid-wait or re-announce an incident that was already open. If Redis is unreachable the watch announces anyway.
Every notification carries incidentId, the idempotency key a receiver needs. It is stable for the whole of one episode (the opening message, any repeats, and the resolution) and changes when a new episode opens.
Actions
topic
Publishes the alert onto a deployment's own subject, where a flow picks it up with an ordinary events source.
{ "id": "a_1", "type": "topic",
  "params": { "deploymentId": "…", "subject": "alerts", "reportTo": ["ada@example.com"] } }
The deployment named here is the one that acts on the alert, which is usually not the one the alert is about: a platform agent watching an integration it does not run. The flow subscribes to alerts; the platform publishes to that deployment's scoped subject.
reportTo is optional and is for a receiver that writes back: it arrives on the payload as reportTo, and it is where that app should send what it finds. It lives on the action so that the addresses are visible to whoever edits the watch, and so that an agent is not the one deciding who hears about an incident. Addresses are validated and capped when the watch is saved.
For how this fits together with the pods that emit the signals and the app that consumes them, see The self-healing loop. For the whole thing built end to end, from this action to an agent that triages the alert and asks a person in Slack before it changes anything, see Agentic self-healing.
There is no way to broadcast an alert to every deployment. The runtime refuses to let a flow subscribe to the platform's own subject plane, because that plane carries every deployment's logs and traces. An alert is addressed to a deployment, and a watch that should reach several names several topic actions.
What arrives
The message body is the notification, as JSON, so a flow addresses it with ordinary CEL: body.watchName, body.outcomes[0].observed.
{
  "kind": "open",
  "at": "2026-09-07T10:00:00Z",
  "watchId": "8f3c…",
  "watchName": "checkout error rate",
  "severity": "critical",
  "incidentId": "71ccdca0…",
  "combinator": "any",
  "matched": 1,
  "total": 2,
  "outcomes": [
    {
      "conditionId": "c_1",
      "kind": "threshold",
      "label": "error_rate gt over 15m, integration checkout",
      "unit": "ratio",
      "op": "gt",
      "threshold": 0.1,
      "observed": 0.24,
      "score": 6.4,
      "samples": 15,
      "denominator": 350,
      "windowFrom": "2026-09-07T09:45:00Z",
      "windowTo": "2026-09-07T10:00:00Z",
      "verdict": "true",
      "reason": "condition_met"
    }
  ],
  "windowFrom": "2026-09-07T09:45:00Z",
  "windowTo": "2026-09-07T10:00:00Z"
}
kind is open, repeat, resolve or close; a flow that only wants the beginning of an episode reads that, and incidentId ties the four together. Every condition is in outcomes, including the ones that did not hold, so a receiver can see which clause fired an any watch. observed is the number in the units a human recognises, score the confidence bound or z-score the comparison was made against, and reason the machine code for why a clause declined. Fields that never got a value are absent rather than zero: an outcome from a fetch that failed carries no window at all.
email
{ "id": "a_2", "type": "email", "params": { "to": ["ops@example.com"] } }Sent through the orchestrator's email settings, so the sender address is defined once and the provider key is never held by this service. Configure email first, or the action records that it could not deliver.
A watch with no actions still records every evaluation and opens incidents; it tells nobody, which the editor warns about rather than forbidding.
Every delivery attempt is logged with which action, which type, and the error. The history records whether an announcement reached anybody at all; which of several actions failed is in the service's logs. A failed delivery never rolls back the transition that caused it, and does not start the cooldown.
Where it lives
The Alerts tab under Metrics in the platform UI. The list gives each watch its phase, its last value and when it last ran; whatever is firing sits above it. Opening a watch gives you the editor and its history together. Try it now runs the definition against real data without saving it, which is the same POST /alerts/preview below.
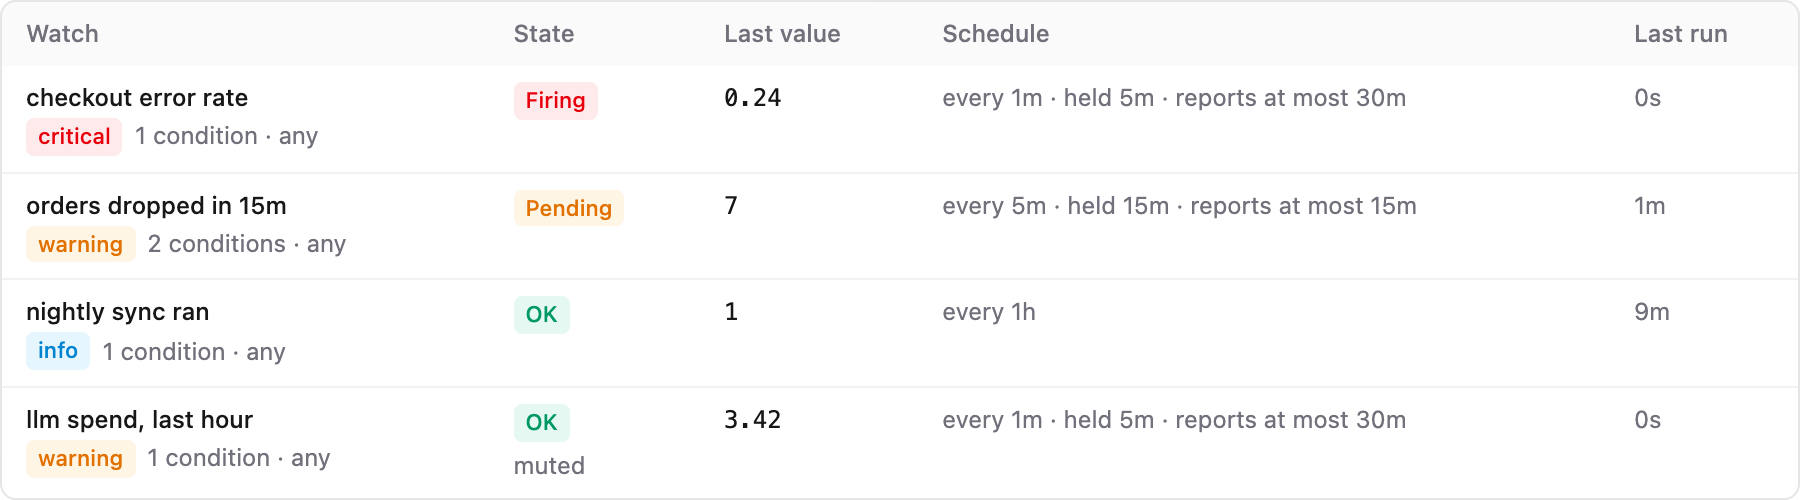
The schedule column reads back as a sentence, so how often a watch is asked, how long its verdict has to hold, and how often it may report are all answerable without opening it.
Trying a watch before you save it
Press Try it now in the watch editor. It runs the definition against real data and reports what each condition observed, without recording anything, moving any state or telling anybody.
The editor is the only way in for now; the observability API is not exposed to platform users yet. On an installation where you can reach the service directly, the same check is one call:
curl -sS -X POST "$OBSERVABILITY_URL/alerts/preview" \
  -H 'Content-Type: application/json' -d @watch.json
This is how a spike's gates get tuned: against history that already exists, rather than by waiting to find out that it never fires.
The execution log
Every evaluation is recorded, including the ones where nothing happened, so an alert that did not go off can be told apart from one that was never evaluated. Opening a watch in the platform shows this history beneath its editor; reaching the service directly, it is one call:
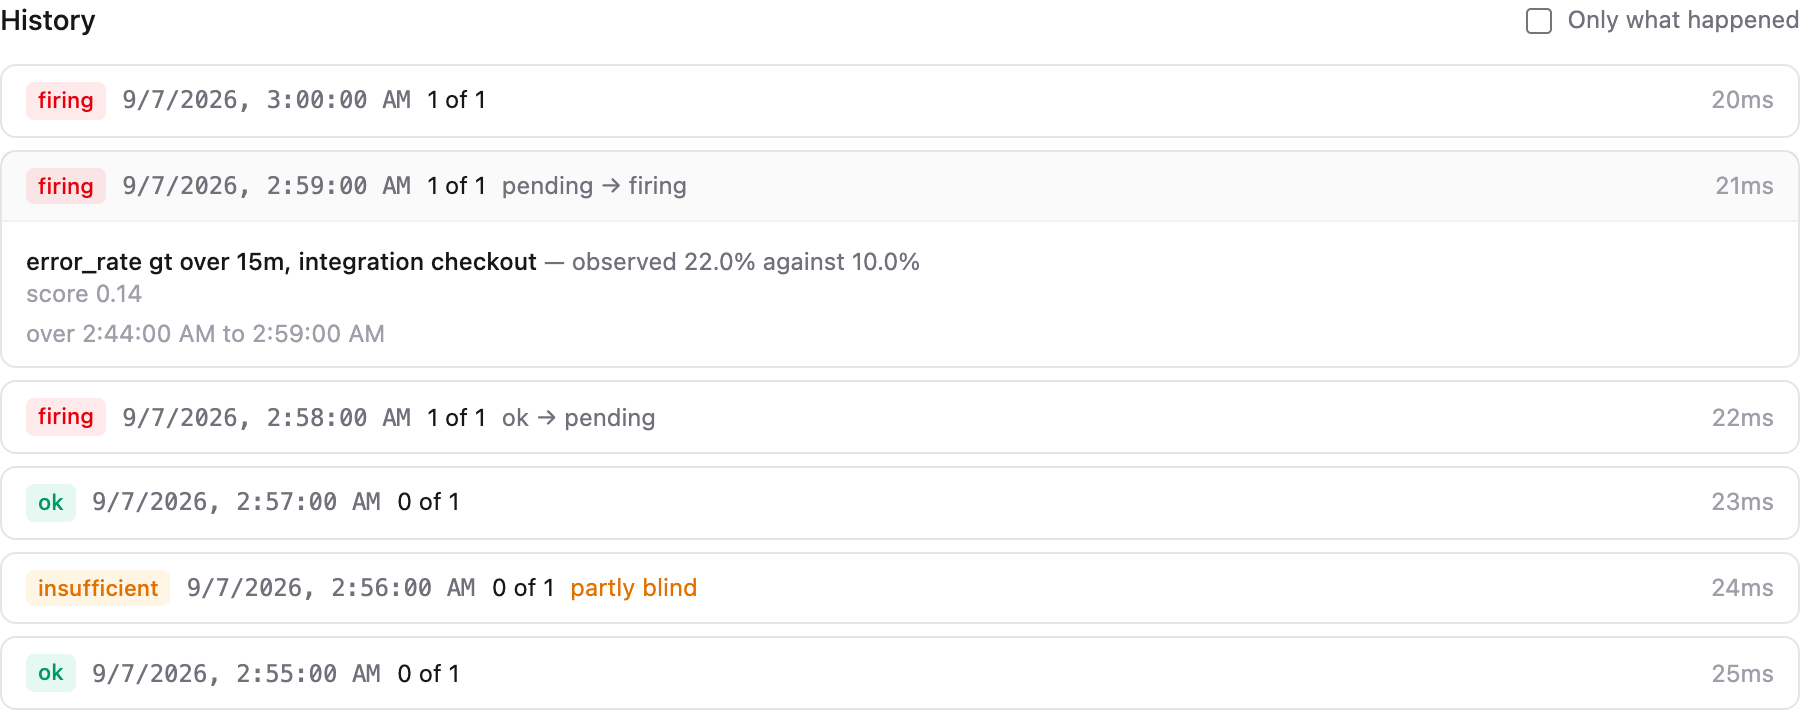
Only what happened is on by default and narrows the log to the evaluations that changed something. Turning it off is what answers the question above.
curl -sS "$OBSERVABILITY_URL/alerts/watches/$ID/evaluations?notable=true"Each row carries the per-condition outcomes as they were (the observed value, the baseline, the threshold), so a row from three weeks ago still explains itself after the watch has been retuned. A row that declined to fire says which gate stopped it: below_z, below_min_delta, denominator_too_small, below_min_baseline, no_data.
status is five-valued: ok, firing, error, insufficient (the window did not hold enough data to decide) and skipped (the evaluator deliberately did not look). "We looked and it was fine" and "we could not look" are the two states you most need to tell apart.
Retention for this log defaults to 14 days; see Data retention.
Running it
The evaluator runs inside the observability service, on exactly one replica, holding a Kubernetes Lease. Ingesting a record twice is idempotent; evaluating a watch twice would open two incidents and send two emails for one outage. Extra replicas still share ingest and answer the API.
The chart grants the service one permission for this, a namespaced Role over coordination.k8s.io/leases. Off-cluster (task observability:run, or the tests) there is no election and the single process evaluates.
An installation may hold 200 watches. Past that the next one is refused rather than accepted into a pass that cannot finish inside its interval.