
The Self-Healing Loop
How a signal a pod emits becomes an alert an agent triages, reports on, and can act on.
A deployed integration emits signals whether or not anybody is reading them. Agentic self-healing is the loop that closes the gap between a signal and a response: the platform turns telemetry into an event, delivers that event to an app, and the app is an agent that can read the evidence, say what it thinks, and act.
The loop is made of parts that already exist on their own. Nothing here is a new subsystem; what follows is how they connect and where each concern lives.
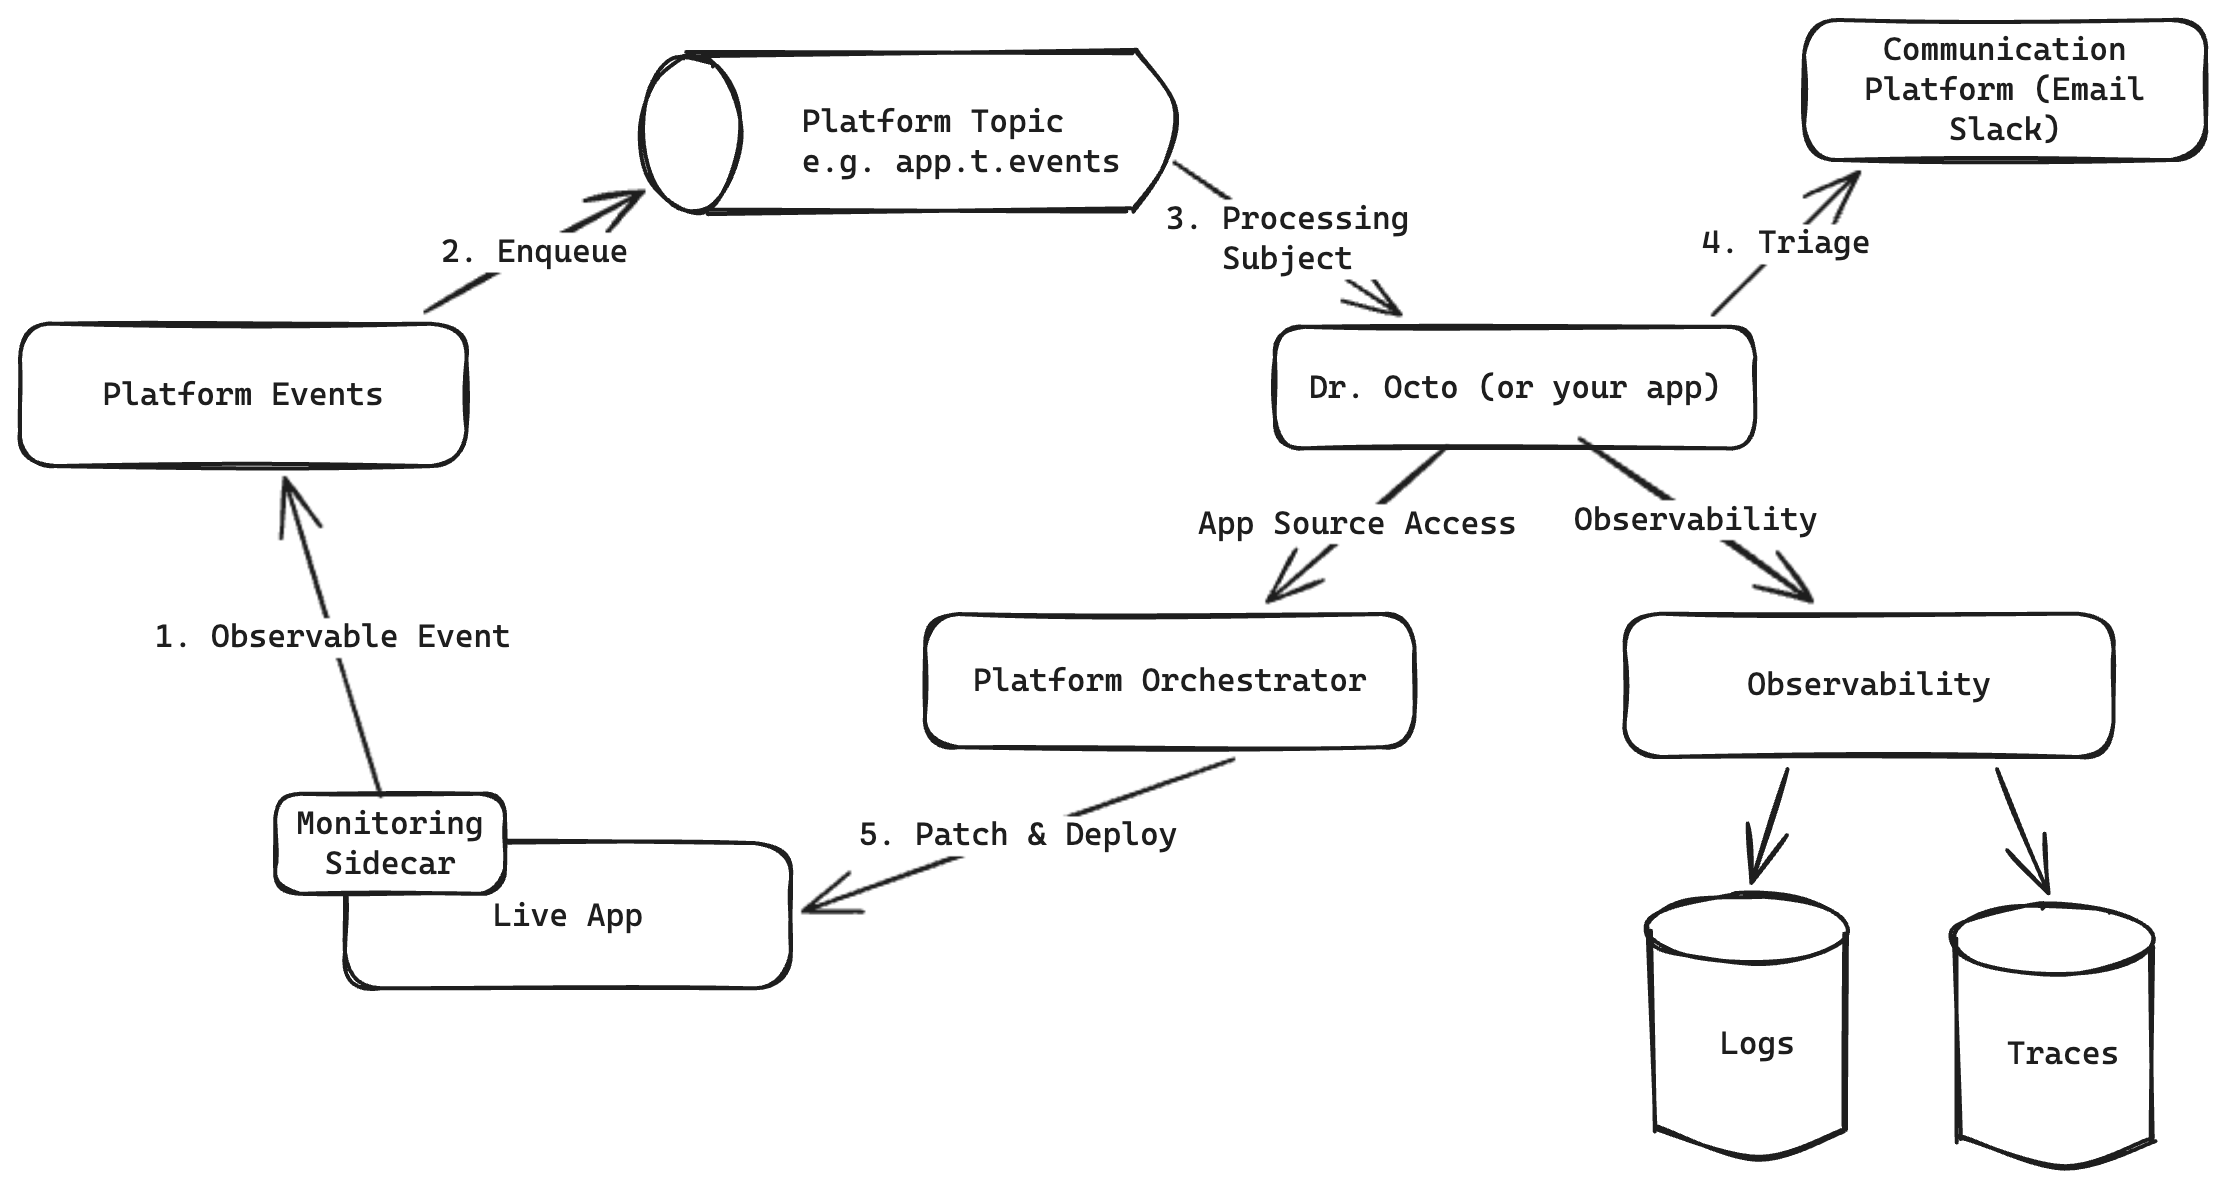
The five steps are the whole story, and the rest of this page is what each one is made of. The one detail worth reading twice is the topic in the middle: an alert is broadcast to a subject scoped to one deployment, not handed to a work queue with competing consumers, and that is what decides which app hears about it.
Signals leave the pod on their own
A deployed pod reports three kinds of thing, and none of them is scraped from outside.
Logs and traces are shipped by the runtime itself. Every pod publishes structured log records to internal.logs, and every pod with tracing on publishes trace records to internal.traces. Both subjects are consumed by the observability service as a competing consumer across every deployment, so the deployment's identity travels inside the record rather than in the subject.
Pod stats come from a sidecar. The runtime can serve Prometheus metrics but nothing scrapes them, so a container beside the runtime samples that endpoint over loopback once a second and writes two tiers to Redis: full resolution for the bucket in progress, one collapsed row per completed bucket for a rolling week. It holds no Kubernetes credential and talks to exactly two peers, the runtime on loopback and Redis.
The sidecar's constraint is worth understanding, because it explains the shape of everything downstream. It must never be able to take a production pod out of service, so both its probes answer 200 whenever the process is running and every failure is counted and logged rather than signalled. Losing statistics is always the right trade against losing traffic. Read Pod Stats for the tiers and Event Bus for the subject map.
A watch turns a signal into an event
Signals are continuous; an event is a judgement about them. That judgement is a watch: a standing question, asked on an interval, whose conditions read the same stores the charts read.
A watch is not a threshold with a message attached. It carries a state machine, and the machine is where the difference between a metric and an incident lives:
| Concept | What it is | Why it exists |
|---|---|---|
The hold (for) | How many consecutive firing evaluations before anything is announced | Counted in evaluations, not wall-clock seconds: five minutes of firing with an evaluation missing in the middle is not five minutes of firing |
| The incident | One episode, from opening to close, with a stable incidentId | The four notifications about one episode belong to one record |
kind | open, repeat, resolve or close | A receiver that only wants the beginning of an episode reads one field |
| Resolve versus close | Two clean evaluations resolve; thirty undecided ones close as stale | Collapsing the two is how a real outage gets recorded as fixed |
Firing state lives in Postgres, because a hold spans evaluations and a process that restarted mid-incident must not re-announce one. See Alerting for the condition kinds and the full definition.
The event is enqueued onto a subject
A watch that fires runs its actions. The one that starts the agentic loop is topic, which publishes the notification as JSON onto a deployment's own subject:
octo.<deploymentId>.t.<subject>The deployment named in the action is the one that acts on the alert, which is usually not the one the alert is about. A platform agent watching an integration it does not run is the ordinary case.
That scoping is a security boundary, not a naming convention. The platform's own subject plane carries every deployment's logs and traces, and the runtime refuses to let a flow subscribe to it, so there is no way to broadcast an alert to every deployment. An alert is addressed, and a watch that should reach several apps names several topic actions.
The payload is the notification. It is built from the evaluation that caused it rather than read back from the database, so the numbers in it are the numbers that fired it:
{
  "kind": "open",
  "at": "2026-09-07T10:00:00Z",
  "watchId": "8f3c…",
  "watchName": "checkout error rate",
  "severity": "critical",
  "incidentId": "71ccdca0…",
  "combinator": "any",
  "matched": 1,
  "total": 2,
  "outcomes": [
    {
      "conditionId": "c_1",
      "kind": "threshold",
      "label": "error_rate gt over 15m, integration checkout",
      "unit": "ratio",
      "op": "gt",
      "threshold": 0.1,
      "observed": 0.24,
      "samples": 15,
      "denominator": 350
    }
  ],
  "windowFrom": "2026-09-07T09:45:00Z",
  "windowTo": "2026-09-07T10:00:00Z",
  "reportTo": ["ada@example.com"]
}
Two fields on it are the ones a receiver is built around. incidentId is the idempotency key: stable for the whole of one episode and different for the next. reportTo is who the receiving app should tell what it found, carried on the alert rather than configured inside the app, so that the addresses are visible to whoever edits the watch and an agent is never the thing deciding who hears about an incident.
An app consumes the subject
There is nothing special about the consumer. It is an ordinary integration with an events source, and the subject it names is relative: the platform expands it to the scoped form above.
flows:
  - name: on-alert
    source:
      connector: bus
      type: events
      settings:
        subject: alerts
    process:
      - type: validate
        name: only-bad-news
        settings:
          rules:
            - expr: 'body.kind == "open" || body.kind == "repeat"'
              message: a recovery or a close carries nothing to triage
The body is the notification, so the flow reads it with ordinary CEL: body.watchName, body.incidentId, body.outcomes[0].observed.
Which app consumes it is the only real choice here. Dr. Octo is the platform's own agent and arrives already knowing how to read traces and change deployments. Your own app starts empty and holds exactly the tools you give it. The Agentic self-healing guide builds both, and the trade is roughly that Dr. Octo is faster to reach and your own app is yours to shape and not overwritten by an upgrade.
Deduplication happens in four places
An agent that runs on every notification is worse than no agent, because it costs money and mails people. Four separate mechanisms decide that a run happens once, and they sit at different layers on purpose.
The hold, in the watch. A condition that is true for one evaluation announces nothing. This is what keeps a spike that lasts one bucket from becoming an incident at all.
The cooldown, in Redis. After a watch announces something it stays quiet for its cooldown, and it is the only bound on how often a watch reports. There is no separate repeat interval: a still-firing watch offers to say so on every evaluation, and one number swallows all but the first, across episodes too. The record is one key per watch, claimed with SET NX so two evaluators racing cannot both decide they are first. Redis is the right place for it precisely because losing it means somebody is told twice, which is the safe direction. A recovery is never suppressed.
The kind, at the front of the flow. A resolve or a close is a notification about an app that has recovered, and triaging one is an agent run and an email about good news. Gating on kind is one validate block, and it belongs in the flow rather than in the source: an events source subscribes, it does not filter.
The incident, inside the app. incidentId is what makes a repeat join the run that is already working. In the sample app it is the agent's memoryThreadId, so a second notification about one episode continues the same conversation instead of starting a fresh investigation with no memory of the first.
These are four answers to four different questions: is this real yet, have we said this recently, is this worth saying at all, and is this the same episode. A design that folds them into one number ends up either noisy or deaf.
Memory is what makes the fourth alert different
Deduplication decides whether a run happens. History decides what that run knows, and it is the difference between an agent that greets every alert as a novelty and one that recognises a fault it has seen three times this week.
Dr. Octo's troubleshooter keeps a record per watch in the persistent object store, alert-history:<watchId>, capped at fifty episodes, holding each occurrence and the finding it produced:
{
  "seq": 3,
  "seen": [
    { "seq": 2, "at": "2026-09-05T02:10:00Z", "incidentId": "40b1…",
      "finding": "the upstream returned 502 for four minutes; no change on our side" },
    { "seq": 3, "at": "2026-09-07T10:00:00Z", "incidentId": "71cc…",
      "finding": "same upstream, same window of the day" }
  ]
}
Keyed by watch rather than by incident, because an incident is one episode and the question this answers is how many episodes there have been. It lives in the persistent tier rather than the volatile one for the same reason: losing the run transcript costs one report, and losing this costs the ability to tell a blip from a fault that keeps coming back.
Acting, and asking first
An agent that can read is useful; an agent that can change a running deployment needs a boundary. Two of them apply here.
The grants an integration is deployed with decide what it can reach at all. App source access goes through the orchestrator, and observability is a separate grant. An agent without them can reason and report, which is a perfectly good place to start.
Tool authorization is the boundary inside a run. A tool marked as needing authorization parks the run and emits an event carrying an authorizationId, and nothing happens until an answer arrives. That answer can come from a person in Slack, which is what turns the loop from automation into review: the agent says what it wants to do, somebody pushes back or confirms, and the run continues from where it stopped. See Tool authorization for the mechanism and Human-in-the-loop for the shapes it takes.
Where to go next
- Agentic self-healing, the whole loop end to end, from creating the watch to a person answering in a Slack thread.
- Alerting for watches, conditions, actions and the execution log.
- Dr. Octo for what the platform's own agent does with an alert.
- Pod Stats and Event Bus for the two halves of how a signal gets out of a pod.